GOLD - Countertrend correction to the liquidity zoneFollowing the false breakout below the 4030 support level, ICMARKETS:XAUUSD is rebounding higher, with recent shifts in the geopolitical backdrop adding fuel to the move. However, the market remains bearish overall.
Optimism sparked by Trump's decision to cancel major strikes against Iran and renewed hopes for a deal has been replaced by fresh clashes in the Strait of Hormuz. Geopolitical instability remains elevated. Against this backdrop, the U.S. Dollar Index continues to hold firm, putting pressure on gold. Hotter-than-expected U.S. inflation data has reinforced expectations of a 0.25% Fed rate hike in December. Sellers are therefore likely to remain in control.
Key catalysts ahead include consumer sentiment and inflation expectations data on Friday, as well as the first Federal Reserve meeting under the new Chair, Kevin Warsh, next week. Geopolitics will continue to play a decisive role
Resistance levels: 4246 – 4315 – 4368
Support levels: 4171, 4100, 4060
The market is reacting to the false breakdown of support, resulting in a countertrend correction. Gold is moving toward a key liquidity zone, with the main area of interest located between 4315 and 4368.
A short squeeze within this zone would confirm a liquidity-driven manipulation and could trigger a reversal, leading to a move lower toward the next key areas of interest.
Best regards,
R. Linda  Short
Short
EURUSD - Consolidation before downward distributionFX:EURUSD maintains its medium-term bearish trend and may continue to decline against the backdrop of a strong DXY
The pair remains in consolidation within the 1.1500–1.1560 range as the market awaits the outcome of the ECB meeting, including the rate decision and Christine Lagarde's press conference. Any signals from the ECB may have only a short-term impact given the strength of the U.S. Dollar Index, which continues to benefit from an unstable geopolitical environment.
On the daily chart, EURUSD remains in a downtrend after breaking and closing below the 200-day moving average in May. Price is currently consolidating within the narrow 1.1530–1.1572 range, building a base for the next move following the ECB meeting
Resistance levels: 1.1575, 1.1584, 1.1661
Support levels: 1.1527, 1.1506, 1.1450
Within the prevailing downtrend, the currency pair may continue moving lower. A breakout from consolidation and a close below 1.1527 could trigger a further decline toward 1.1450.
Best regards,
R. Linda BITCOIN - Correction before the decline. Bearish trend BINANCE:BTCUSD.P remains in a bearish trend on both the local and global timeframes. Following the sharp sell-off and the formation of a new low, the market has entered a corrective phase, which may not last long
Bitcoin remains trapped in a deeply bearish structure after failing to establish acceptance above the 64,500 resistance zone and being rejected from that area on Tuesday. On both the daily and weekly timeframes, the market is returning to retest key technical levels. Technically, there is still no sign of strong institutional buying activity, and during this countertrend correction the market may form another short squeeze before continuing lower. From a medium-term perspective, Bitcoin may extend its decline toward major historical support levels at 53,500–49,000.
Resistance levels: 62350, 64250
Support levels: 60700, 59700
Bitcoin's global bearish structure remains intact. The market is testing the key 60K support zone, but the reaction remains relatively weak. As a result, the probability of a continuation lower is increasing. The next major downside target is 53K.
Technically, the market has left significant liquidity above the key daily level, as well as a liquidity pool above 64,250. A short squeeze into these areas could trigger a move lower toward the key zones of interest
Best regards, R. Linda  Short
Short
GOLD - A countertrend correction before a decline ICMARKETS:XAUUSD is in a corrective phase after printing a new low at 4268. Both the local and global bearish trends remain intact; however, the geopolitical backdrop continues to be unstable
Gold is undergoing a fundamental and technical shift to the downside, driven by several factors acting simultaneously: a sharp increase in expectations for further Fed rate hikes (now above 70% by December), a break and close below the 200-day moving average for the first time since October 2023, a stronger U.S. dollar above the psychological 100.0 level, and rising Treasury yields toward the 4.55–4.57% range
Technically, the market remains under pressure, and short positions continue to be the preferred strategy. A short squeeze into a liquidity zone could trigger another sharp decline toward support and lower target levels. However, a sudden positive shift in the fundamental backdrop could invalidate the local bearish structure
Resistance levels: 4353, 4368, 4400
Support levels: 4311–4300, 4268
The U.S. dollar is consolidating after a strong rally but shows no signs of weakness. This technical factor continues to weigh on an already bearish gold market.
From a technical perspective, gold may perform a retest of resistance as part of a liquidity-hunting move. A short squeeze into the 4380–4400 area could trigger a decline toward the key zones of interest at 4300–4250
Best regards, R. Linda Short 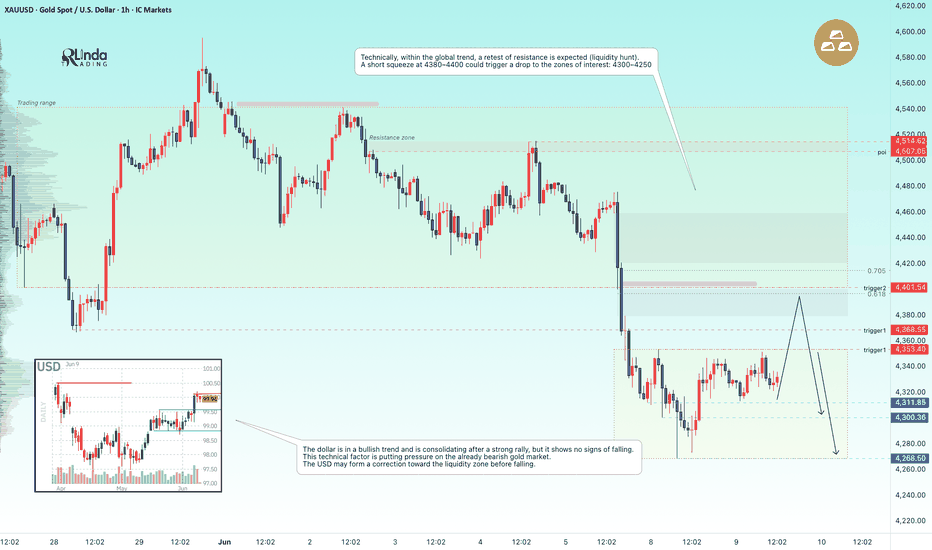
ETHUSDT - A countertrend correction before a decline Following a sharp decline, BINANCE:ETHUSDT is transitioning into a corrective phase, during which the market may enter a liquidity-hunting stage before another leg lower
The current rebound appears corrective in nature within a broader bearish trend. A breakout above 1,800 with strong momentum could improve the short-term outlook, but a recovery above $2,000 is required to shift the global trend. A loss of the 1,600–1,550 support zone would open the way toward 1,500 and then the key 1,400 area, where the monthly trendline is located.
The fundamental backdrop remains weak, and the market has shown only a muted reaction to the CLARITY Act headlines
Resistance levels: 1,712–1,721, 1,812
Support levels: 1,600, 1,550
A short squeeze could trigger a decline toward 1,600, while a close below 1,600 would open the potential for further downside toward 1,550–1,500. Long positions against the trend should be approached with caution
Best regards, R. Linda  Short
Short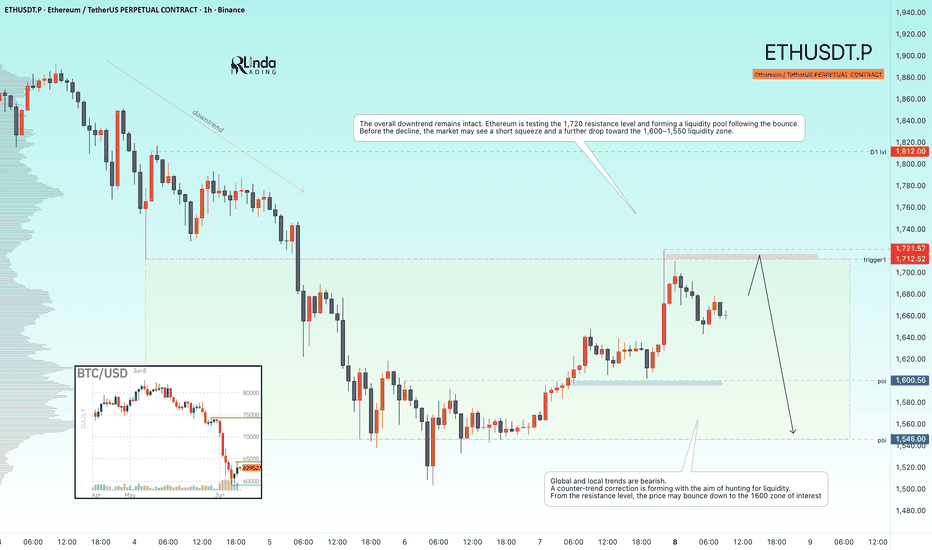
GOLD - Bear market. A correction before the decline ICMARKETS:XAUUSD has broken below consolidation support, exiting the range and transitioning into a continuation of the downtrend. The key drivers are Friday's NFP report and a strong U.S. dollar
Gold is experiencing a bearish shift in both its fundamental and technical backdrop. The labor market report has altered expectations for future Fed policy, while the break below the 200-day SMA is adding significant pressure to the metal. The only notable positive factor remains the COT data: smart money positioning continues to be bullish and is at an 18-week high, even as price continues to decline.
A short-term corrective rebound toward the 4,368–4,400 area remains possible before the downtrend resumes. A close below 4,300 would open the path toward 4,260, followed by the 4,160–4,030 zone. For a trend reversal to occur, price would need to recover above 4,510–4,590, which can theoretically be viewed as the key reversal threshold
Resistance levels: 4,368, 4,400
Support level: 4,300
At the end of the trading session, the market began a correction that may extend toward the highlighted areas of interest at 4,368–4,400. A short squeeze could trigger a continuation of the decline toward the key daily level and liquidity zone at 4,300
Best regards, R. Linda Short 
 Short
Short
BITCOIN - A pullback before a drop to 60K, or perhaps even lowerBINANCE:BTCUSDT is moving toward 59,800 — the key support zone. However, after retesting a local level, the market is forming a correction against the broader trend
The market remains in panic mode and is testing the 60K area. Dynamic buyers have yet to appear, while fear continues to intensify. A move below 60K could trigger a cascade of liquidations, as many institutional hedging strategies are concentrated around this level.
There is currently no fundamental support for the market, while a series of weak news catalysts has fueled aggressive selling. Large funds continue transferring Bitcoin to exchanges.
Technically, the primary area of interest remains 59,800–53,300. Before reaching this target zone, Bitcoin may enter a local corrective phase
Resistance levels: 64,000, 64,740, 65,360
Support levels: 61,350, 59,800
A long squeeze from local support is driving the current correction. Technically, this is not buying pressure but rather a reaction to profit-taking. The market has entered a liquidity-hunting phase ahead of a potential continuation lower. Key triggers (areas of interest) are located at 63,955 and 65,360. A short squeeze could trigger the next leg down.
Best regards, R. Linda Short 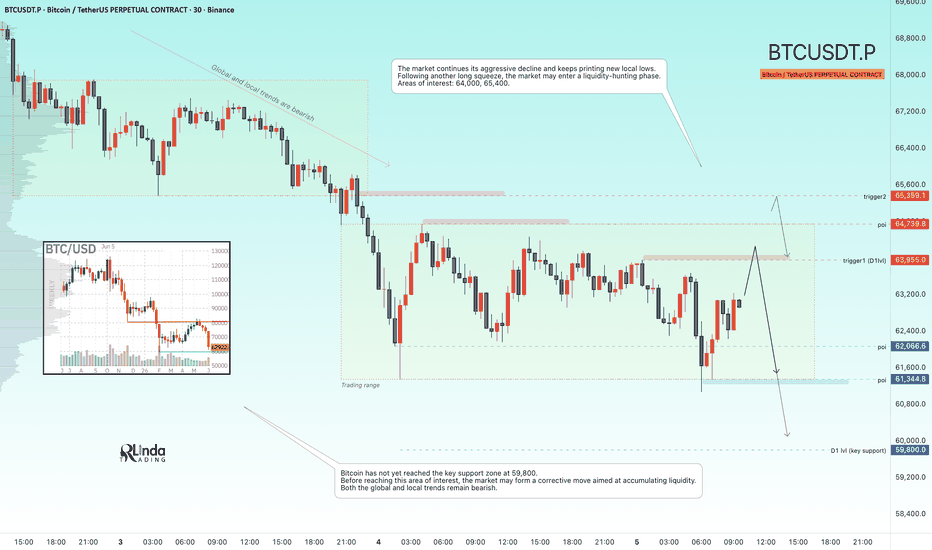
GOLD - The bearish trend may continue...ICMARKETS:XAUUSD has entered a corrective phase after printing a new local low. Against the backdrop of a strong U.S. dollar, the bearish trend in gold may continue...
Gold has received temporary relief from ceasefire-related headlines, but pressure from the dollar and hawkish Fed expectations remains intact. The key event ahead is Friday’s Non-Farm Payrolls (NFP) report. Geopolitical developments continue to play a decisive role.
Technically, within both the global and local downtrend, gold is consolidating inside the 4425–4550 range. Due to the uncertainty factor, the market has entered a corrective phase and a liquidity-hunting stage, during which it may test either 4496 or 4540 before resuming its decline.
Resistance levels: 4496, 4540, 4589
Support levels: 4456, 4425, 4400
The U.S. dollar remains in stagnation (consolidation) within a bullish trend. The geopolitical backdrop continues to support the dollar and weigh on gold, which is currently in a corrective phase. A short squeeze at 4496 could trigger a decline toward 4425–4400. Additionally, if the market fails to react at 4496, gold may test 4540 before moving lower.
Best regards, R. Linda Short 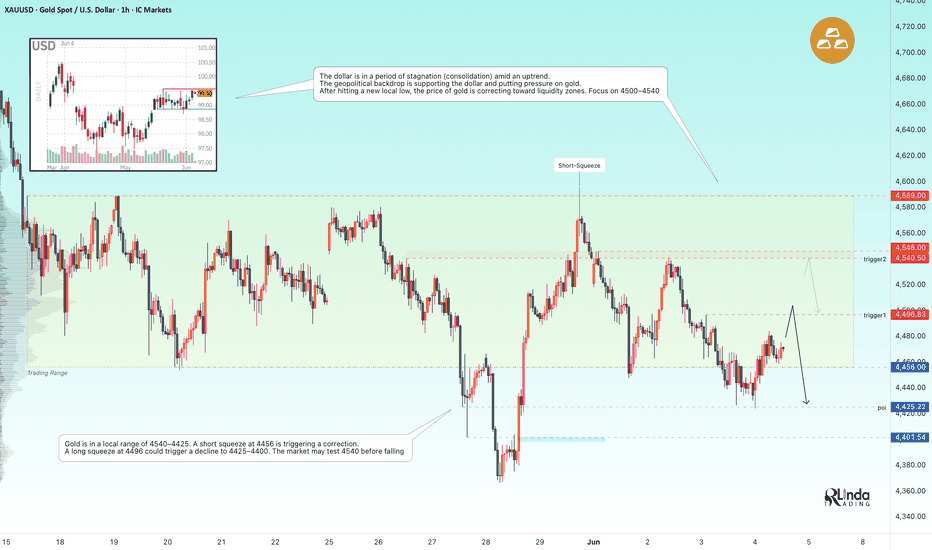
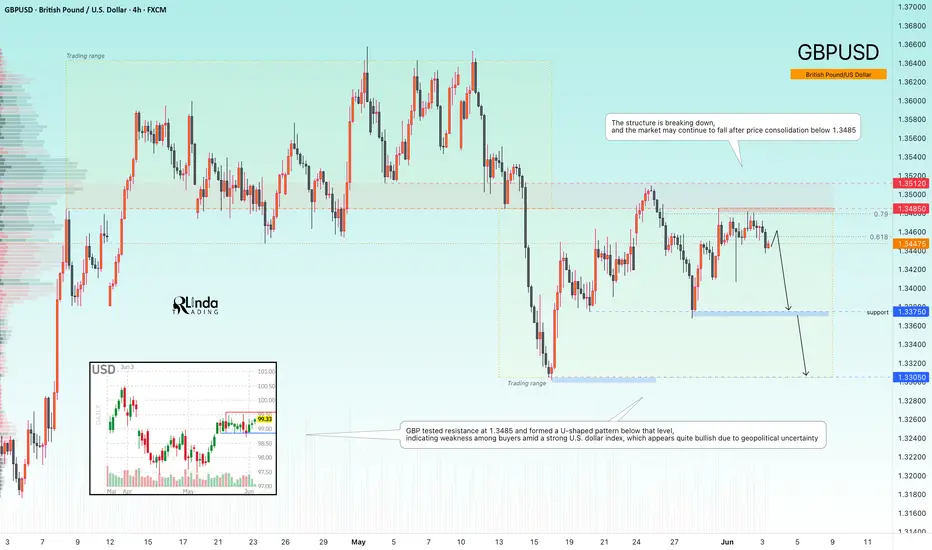
GBPUSD - bearish U-pattern relative to resistance FX:GBPUSD remains in a corrective phase, but after encountering resistance at 1.3485, the pair is breaking its local structure and preparing for a potential decline
Based on market positioning data, large players continue to maintain a bearish bias. At the same time, the growing concentration of short positions created the conditions for the short squeezes seen in late May and early June. Technically, a strong U.S. dollar, which is attempting an upward distribution move amid geopolitical tensions, is weighing on the pound. Meanwhile, GBPUSD continues to consolidate below key resistance, opening the door for a move toward support zones
Resistance levels: 1.3485, 1.3412
Support levels: 1.3375, 1.3305
GBPUSD tested the 1.3485 resistance level and formed a U-shaped pattern below it, signaling buyer weakness against the backdrop of a strong U.S. Dollar Index. The structure is breaking down, and the market may continue lower following consolidation below 1.3485. The primary areas of interest remain 1.3375–1.3305.
Best regards, R. Linda GOLD - The hunt for liquidity ahead of the fall ICMARKETS:XAUUSD remains trapped within the 4450–4590 trading range. A long squeeze from support is triggering a rebound toward the liquidity zone or the range resistance. The primary trend remains bearish...
The U.S. dollar remains bullish due to geopolitical uncertainty. The index is consolidating above 99.0 and is positioned to move higher if tensions escalate. Oil also continues to show strength, which collectively creates pressure on the gold market, as gold remains in both a local and global bearish trend. Gold is stuck inside a range. The nearest catalysts are Middle East developments, today's JOLTS job openings data, and Friday’s Non-Farm Payrolls (NFP) report.
Drivers:
Upward: Progress in U.S.–Iran negotiations, de-escalation in Lebanon, a weaker dollar, weak U.S. labor market data.
Downward: Breakdown of negotiations, escalation, rising oil prices, hawkish Fed rhetoric, a stronger dollar
Resistance levels: 4540–4546, 4589
Support levels: 4510, 4462, 4450
Gold is approaching the liquidity zone quite aggressively. Technically, this may represent a liquidity grab before a further decline. Against the backdrop of both the local and global bearish trend, short positions remain the preferred bias. A short squeeze at 4540 (4546) could trigger a move down toward 4450. However, it cannot be ruled out that the market may test the current range resistance due to liquidity resting above 4589 before resuming its decline.
Best regards, R. Linda Short 
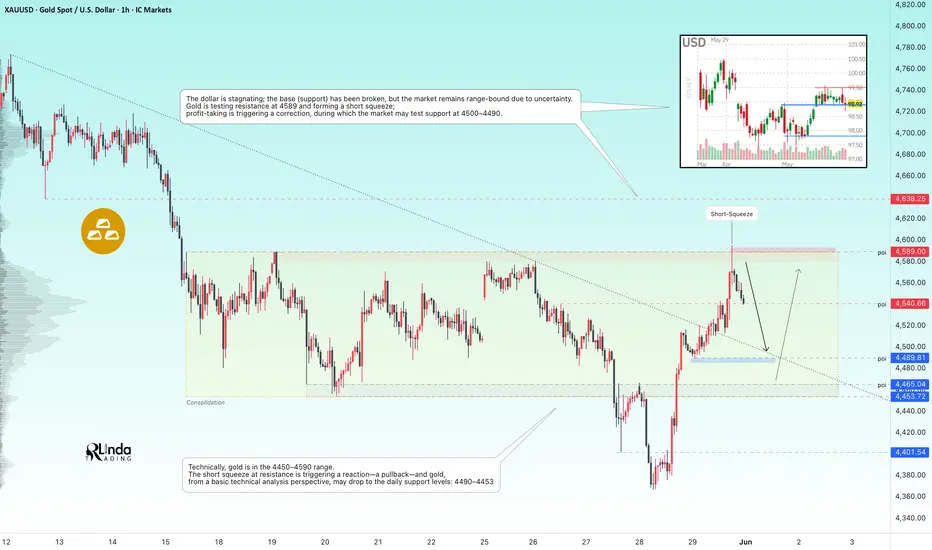
GOLD - A short-squeeze triggers a correctionICMARKETS:XAUUSD volatility continues to increase due to geopolitical factors. A ceasefire framework has reportedly been agreed upon, but it has not yet been officially signed, leaving the market trapped within its current trading range
The U.S. dollar remains in stagnation. While its underlying support structure has been broken, the market continues to hold within a range due to ongoing uncertainty. Gold is also trading within a range after retesting the 4589 resistance level. A short squeeze has formed, and profit-taking is now driving a corrective move that could lead to a retest of the 4500–4490 support zone.
As of May 31, the agreement has not been officially signed. Reports suggest that the deal is still awaiting approval from Trump and Tehran, while negotiations over the final wording continue. Should the agreement be formally approved, the geopolitical risk premium is likely to decline further. However, any breakdown in negotiations could immediately revive demand for safe-haven assets and push both oil and gold higher
Resistance levels: 4589, 4638
Support levels: 4540, 4489, 4453
From a technical perspective, the market previously broke local downtrend resistance. However, after testing 4589, price formed a false breakout, triggering a corrective phase. The current move may be aimed at retesting support before another attempt higher. Nevertheless, the broader trend remains bearish.
Best regards, R. Linda Short 
BITCOIN - Bearish trend. Short squeeze before the drop... BINANCE:BTCUSDT.P continues to develop a bearish trend that aligns with the broader global downtrend. Within the current distribution phase, the market has printed a new low at 72,500 and has since moved into consolidation
As of May 29, U.S. spot Bitcoin ETFs recorded their tenth consecutive day of net outflows, while large holders continue transferring BTC to exchanges. Capital managers remain net long, but positioning has been reduced from the peaks seen in April. Large speculators (hedge funds) are also maintaining a moderate net-long exposure, although there has been no meaningful increase in bullish positioning.
The market remains highly sensitive to geopolitical developments. Despite ongoing rumors of a potential agreement, volatility and uncertainty are likely to persist over the medium term.
From a D1–W1 perspective, Bitcoin reversed its local trend after a false breakout above the 80K–82K zone and is now accelerating to the downside. The market is heading toward the daily correction support area, with the primary zone of interest located at 71,500–70,500. I expect price could reach this target following a retest of the liquidity zones at 74,200, 74,750, and 75,300
Resistance levels: 74,200, 75,300, 76,000
Support levels: 72,500, 70,670
At this stage, there is no compelling case for new long positions or medium-term buying. Market structure remains weak, and any upward movement should be viewed as a potential opportunity to look for short entries.
The key area of interest, where a retest could trigger a reversal and renewed downside pressure, remains 74,200–75,300. A short squeeze could provide an attractive setup for such a move.
Best regards, R. Linda Short 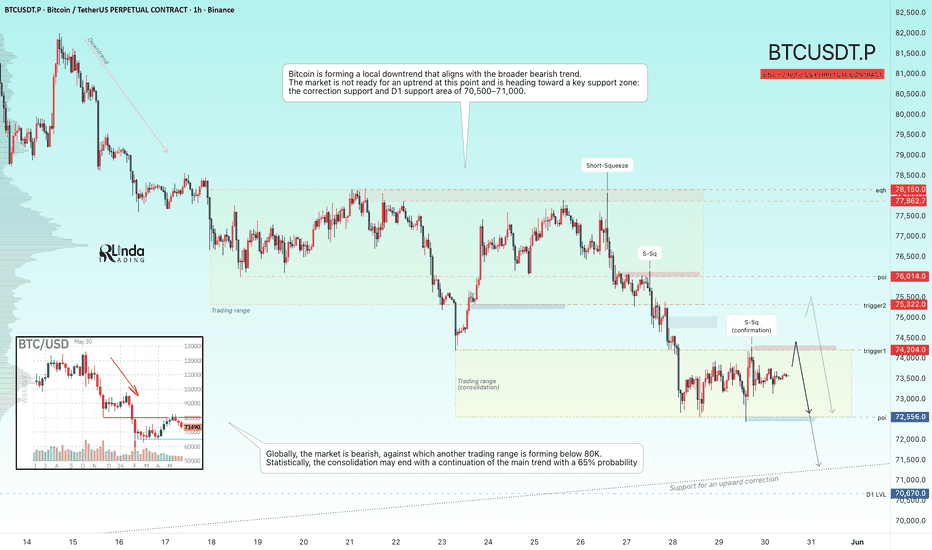
PLTR Descending Triangle Failure After 5 Months of ConsolidationPLTR formed a descending triangle pattern between January and May 2026, with resistance falling from $200 down to approximately $145 and support holding firmly at $128. The standard expectation for this pattern is a bearish continuation, breaking down through the horizontal support. Last week price action delivered the opposite: a 9.21% breakout above the descending resistance line, accompanied by volume of 92.2M shares, which represents a 5-month local volume peak.
When a traditionally bearish pattern fails and breaks in the opposite direction, the resulting move tends to be stronger than a standard breakout. Short positions accumulated during the 5 months of consolidation, anticipating the textbook bearish resolution, become forced buyers when the breakout occurs upward. This short-covering pressure compounds the initial momentum.
One timing consideration is worth noting before assuming the standard measured move target. The breakout occurred at approximately 83% of the way through the triangle, measured from the widest point of the pattern to the apex. The optimal breakout zone for triangle continuation patterns falls between 50% and 75% of the pattern's duration. Breakouts in the 75-90% zone remain valid but carry statistically reduced reliability compared to earlier-stage breakouts. Two factors partially compensate for this late timing here: the breakout day volume sits significantly above the multi-month average, and pre-market action shows continuation with an additional 1.8% above the prior close. These factors keep the setup tradeable, but the measured move target should be regarded as a possibility rather than a high-probability outcome.
Volume profile throughout the formation aligns with the pattern. Volume declined gradually from approximately 80M daily in January to 40-50M by late May, which is the typical contraction expected during a triangle consolidation. The 92.2M breakout day volume is therefore significant both in absolute terms and relative to the recent baseline.
The measured move calculation is straightforward. Triangle height at its widest point equals $200 minus $128, or $70. Applied from the breakout point of $138.99, the projected target sits at approximately $209. Intermediate resistance levels that may serve as partial profit-taking zones include $167, $182, $198, and the Jan-Feb high's.
Risk management levels. The tightest invalidation point is a daily close below $143.59, the breakout line itself. A more conservative swing stop sits below $138, which coincides with both the broken descending line and the 20-day moving average. Absolute pattern invalidation occurs on a daily close below $128, which would reactivate the bearish triangle and project a downside measured move.
Not investment advice. Personal analysis shared for educational discussion. Constructive criticism and alternative interpretations are welcomed.  Long
Long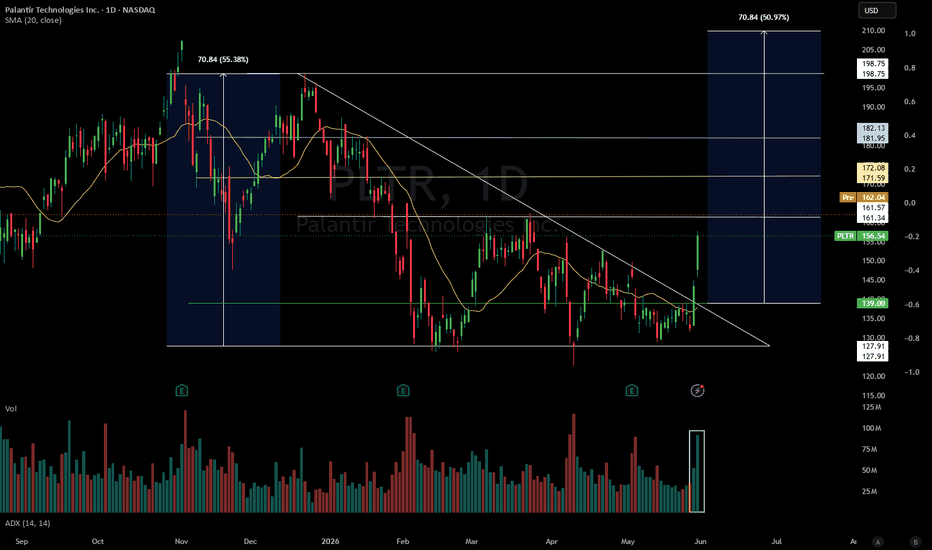
GOLD - Correction toward the resistance of the range ICMARKETS:XAUUSD continues to react to the geopolitical backdrop, while still remaining under pressure from both the global and local bearish trend. Meanwhile, the U.S. dollar remains in stagnation, forming a trigger around the 99.0 area
Optimism surrounding a potential peace deal has started to fade amid ongoing hostilities. The dollar remains range-bound, but at the same time continues to receive support from geopolitical tensions and hawkish rate expectations. Further movement in gold will largely depend on developments around the ceasefire narrative and oil market dynamics.
Key catalyst:
- Official confirmation by Trump of the proposed 60-day ceasefire with Iran (or a breakdown of negotiations).
Drivers:
- Bearish — Failed negotiations, escalation, hawkish Fed rhetoric, a stronger dollar, rising oil prices
- Bullish — Official ceasefire confirmation, de-escalation, dovish Fed signals, declining oil prices
Resistance levels: 4540, 4580, 4600
Support levels: 4488, 4465, 4450
Technically, gold has returned back into the trading range. A retest of the 4540 liquidity zone could trigger a corrective move toward support (a manipulative move) before a potential continuation higher toward the upper boundary of the range.
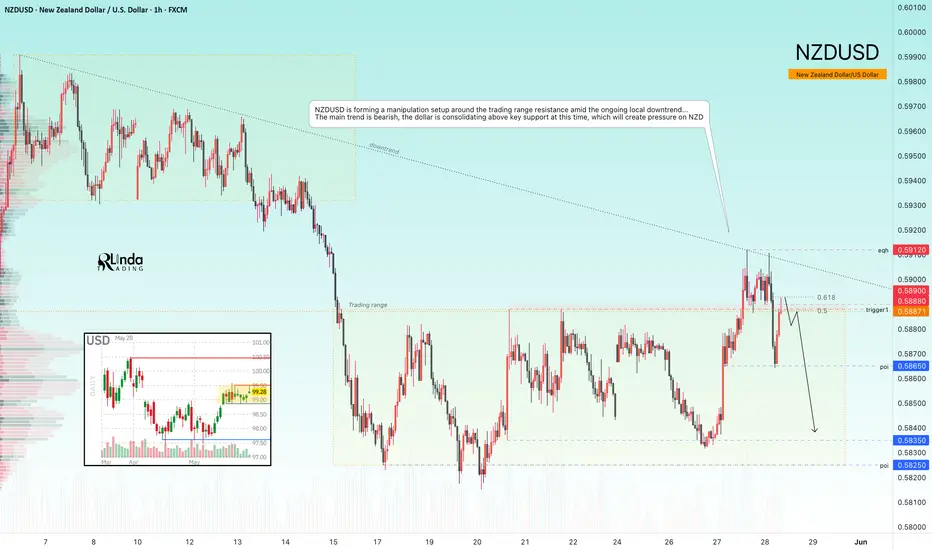
Best regards, R. Linda NZDUSD - A false breakout of resistance amid a bearish trendFX:NZDUSD is forming a manipulation setup around the trading range resistance amid the ongoing local downtrend...
NZDUSD remains trapped in a difficult position: the RBNZ is being forced to tighten policy against a weakening economy due to external shocks. The market has already priced in two more rate hikes before year-end, providing downside support around the 0.5800 area. Positioning data from major market participants continues to reflect a consolidated bearish bias on NZD. This underlying structure has not changed even after the RBNZ’s hawkish signal — medium-term players still do not believe in the sustainability of NZD strength amid deteriorating economic conditions.
From a technical perspective, a false breakout is developing around the D1–W1 resistance zone...
Resistance levels: 0.5890, 0.5912
Support levels: 0.5865, 0.5835, 0.5825
Locally, the market is bouncing from 0.5865 amid a rebound in the DXY index, but the broader structure remains intact. The pair is currently testing an imbalance zone, and a local short squeeze could trigger a decline toward the lower boundary of the range, with potential continuation toward medium-term lows.
Best regards, R. Linda BITCOIN - The hunt for liquidity ahead of the fall BINANCE:BTCUSDT is forming a downtrend both globally and locally. The focus is on the key support and resistance levels of 75,300–78,100; within the intraday price action, following a sharp decline, the price has entered a phase of liquidity hunting.
Large companies continue to transfer bitcoins to exchanges; U.S. spot bitcoin ETFs have seen outflows for the sixth consecutive day; asset managers and dealers are in a net long position, but leveraged speculators are holding a significant short position, which is creating pressure.
On May 14, the CLARITY bill passed the Senate Banking Committee by a vote of 15–9 and is awaiting a full vote. The market has already reacted to rumors, and going forward, it may already price in the news. At this point, it is worth focusing on the technical context—a downtrend, short squeezes, and new lows.
Resistance levels: 76,000, 76,650, 78,100
Support levels: 75,300, 74,200, 73,700
A correction is forming, during which the market may test areas of interest and liquidity before falling. Focus on 76K – 76,600 and 77,800. A short squeeze could trigger a sell-off. Consolidation below 76K – 75,300 will intensify pressure from the bears.
Best regards, R. Linda! Short 
GOLD - Flat, pressure from bearsICMARKETS:XAUUSD is giving up all of Monday’s gains and may test the 4,500 level again. The immediate direction will be determined by developments surrounding the negotiations and the fragile ceasefire, as well as oil price movements. As long as risk aversion and the dollar remain dominant, gold will stay under pressure
The positive sentiment surrounding the ceasefire that emerged over the weekend quickly turned negative. The dollar is currently stagnating but is consolidating above key support, which is putting pressure on gold. The resumption of oil price growth is fueling inflation fears, bringing “hawkish” expectations regarding the Fed rate back to the forefront. The market estimates the probability of a rate hike by the end of the year at just over 50%
Drivers:
Downside: Escalation, breakdown of negotiations, rising oil and dollar, hawkish signals from the Fed.
Upside: Progress in negotiations, de-escalation, falling oil, weakening dollar
Resistance levels: 4540, 4580, 4589
Support levels: 4500, 4488, 4465
Technically, consolidation below 4540 could lead to a decline to 4488 (liquidity zone). However, a primary retest of support and a long squeeze could trigger a minor pullback to 4540 before the decline continues to 4450–4420
Best Regards, R. Linda! Short 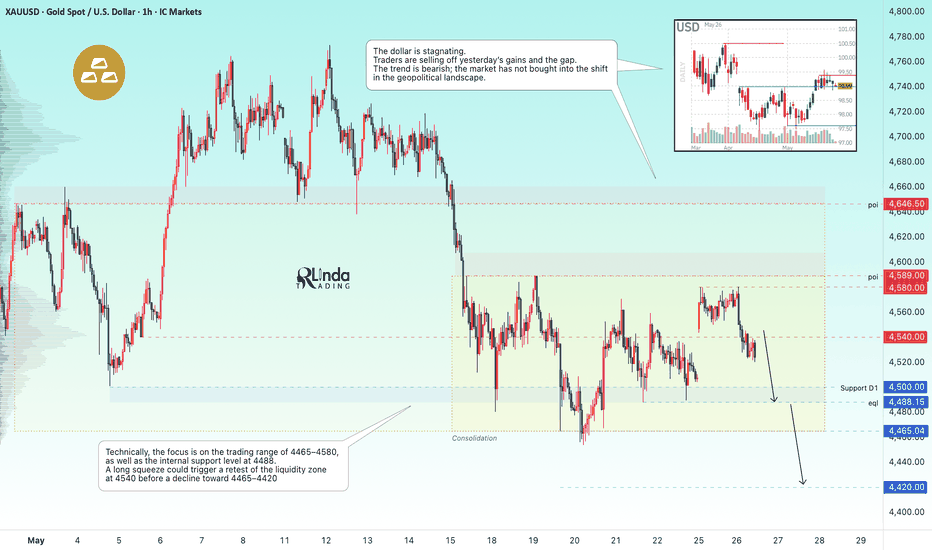
GOLD - The geopolitical backdrop is changing ICMARKETS:XAUUSD closed Friday’s session near 4,500 and looks fairly weak, with a bearish bias. However, the geopolitical backdrop is shifting over the weekend, which could trigger a gap or a locally positive tone in the market
Following a phone call between Middle Eastern countries and the U.S., Trump stated: “The agreement is largely agreed upon and awaits final approval between the United States of America, the Islamic Republic of Iran, and various other countries.”
On May 22, the new Fed Chair Kevin Warsh was officially sworn in, promising a “reformist” approach but emphasizing independence from the White House. Key catalysts for the coming week: U.S. GDP data (Q1), core PCE (the Fed’s inflation indicator, May 28), as well as developments in the Iran negotiations.
Resistance levels: 4540, 4589, 4646
Support levels: 4500, 4488, 4465
Technically, the market may react quite positively to the shift in the geopolitical backdrop. Bulls may hold the 4500 area, and at the session open, the price may open with an upward gap or continue its movement sharply; a breakout of the local trend line could strengthen the momentum.
There is a possibility of growth to 4589 - 4646 - 4734
Best regards, R. Linda! Long 
BITCOIN - The hunt for liquidity ahead of the fall BINANCE:BTCUSDT.P has hit a new low of $76K and is testing local support; due to a lack of liquidity, the market may form a correction toward the imbalance zone...
Bitcoin’s global trend is bearish, within which a local bullish channel is forming, aimed at consolidation. A break of the local upward support returns the market to a bearish environment.
Technically, the price is testing the 76,100 support level and forming a correction aimed at seeking liquidity. Key levels to watch include 78,300, 78,700, and 79,460. A short squeeze and the formation of a reversal pattern could return the price to a downward trend
Resistance levels: 77,600, 78,700, 79,460
Support levels: 76,100, 75,600
Focus on the 77,600 consolidation resistance; a breakout could trigger an upward impulse toward the 78,700 imbalance zone in a liquidity hunt. A short squeeze in the resistance zone could return Bitcoin to a downtrend.
Best Regards, R. Linda! Short 
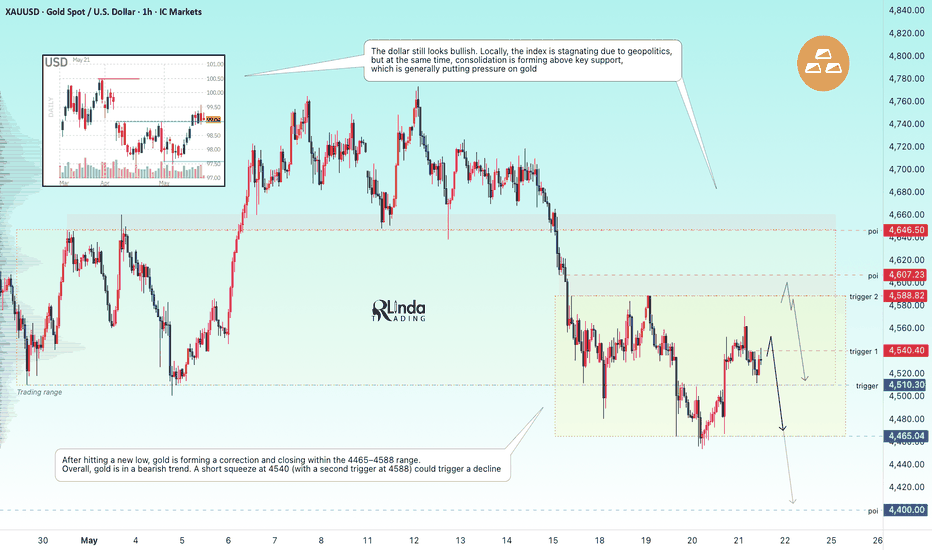
GOLD - The pressure of the global bearish trendICMARKETS:XAUUSD is trading near the key daily support level of 4,510; the reaction within the long squeeze is weak, and the market continues to maintain a bearish structure. Meanwhile, the dollar is stagnating
Gold received support from geopolitical optimism on Wednesday, but the Fed’s hawkish stance and the possibility of a breakdown in negotiations are holding back gains. Today’s PMI data and developments regarding Iran will determine whether gold can hold above $4,600
Technically, the market is under pressure from bears within the medium-term trend. Locally, the focus is on two key triggers: the control point and the liquidity zone at 4,540. The second key zone is the resistance of the current local range at 4,588–4,607.
Resistance levels: 4,540, 4,588, 4,607
Support levels: 4,510, 4,565, 4,400
Locally, the dollar is stagnating due to geopolitics, but at the same time, consolidation is forming above key support, which is generally putting pressure on the metal. After hitting a new low, gold is forming a correction and closing within the 4465–4588 range; the reaction from the bulls is relatively weak. A short squeeze at 4540 (second trigger at 4588) could trigger a decline. A close below 4510 could trigger a drop to 4400
Best Regards, R. Linda! Short