SUI even after a 80% rally this chart isn't bullish enoughSame behaviour three times now. Each leg down has ended with a vertical spike through the range high that held for a handful of daily candles and then failed: 2 in January, 1.4 in May, and 1.2 this month. The 80% move off 0.65 looks impressive in isolation, but structurally it's the third instance of the same failed breakout, not a trend change.
The other problem is time. Real accumulation takes years of flat, boring range with volatility bleeding out of the market. What we have here is a base
Economic Cycles
My 3-Phase Bitcoin Bear Market Timing ModelThis is my Bitcoin Timing Model, designed to break the bear market cycle into three distinct phases.
The model is based on recurring timing relationships I’ve observed across previous Bitcoin cycles and the broader macro environment.
Phase 1 — Initial breakdown / transition into the bear market
Phase 2 — Continuation and consolidation as the cycle develops
Phase 3 — Final stage of the bear market, where I watch for the last major leg down and eventual cycle low
One of the more interesting c
Gold | Has the Triangle Completed and Is the Next Bearish Wave B⏱️ Reading Time: ~2 minutes
In our previous analysis, we considered both bullish and bearish scenarios.
However, based on the current structure, the bullish scenario is temporarily off the table.
🔻 Bearish Scenario
If the Triangle shown on the chart has indeed completed, the current move may mark the beginning of a new bearish structure.
In this case, we would expect the decline to develop through at least a three-wave structure. The important point is that a deeper decline could retrace a s
Bitcoin 15M | Structure Must Confirm the Path⏱️ Reading Time: ~2 minutes
Hey everyone,
In this short-term Bitcoin update, I’m looking at two main paths. At the moment, however, the bearish scenario has the stronger structural position.
🟢 Bullish Scenario
For the bullish scenario to become more convincing, the market needs to prove itself through a clear motive structure.
Simply breaking above a resistance level or making a sharp move higher is not enough for me. The new advance should develop a recognizable impulsive structure, follow
Brent Crude Oil | Is a Nested Structure Developing?⏱️ Reading time: About 2 minutes
In this latest 4H update of Brent crude oil, the main focus remains on the bullish structure. However, this scenario can only become stronger if the market continues to maintain a sequence of nested structures across multiple degrees.
At the moment, after the initial wave, we are watching the development of 1&2 structures across different degrees. The recent decline does not invalidate this scenario by itself, as it could still be part of a lower-degree correct
ETHBTC weakness vs SOLBTCMost altcoins will just bleed forever against BTC. This has been the case with all majors, including the biggest one, ETH, that's been on a massive 9 year downtrend against BTC.
Over this last cycle we saw Solana totally dominate the industry while Ethereum lagged badly. As a result, we got the nasty dump back to the white box in this ETHBTC pair (the support from last cycle) and the low $1400s on the USD pair.
Now it seems ETHBTC has finally broken out of the macro downtrend, - just barely -
SOL strength against BTC vs ETH'sThe SOLBTC pair is much stronger
than the ETHBTC pair. Even with the massive beating SOLUSD took from ATH, wasn't nearly enough compared to the ETH beating on the BTC pair.
Considering this, I'd argue that this strength suggest SOL might be able to break the downtrend ETH against BTC that never could.
Very bullish on Solana and $SOL.
Bitcoin, Global M2 & Fed Chair TransitionsOne pattern stands out on this chart: shortly after each Fed leadership announcement or transition shown, Global M2 begins to weaken, liquidity dries up, and markets move toward a more risk-off environment.
New chair, new policy backdrop, then liquidity begins to shift.
This doesn’t mean the chair change causes the liquidity contraction, but the timing is worth watching as part of the broader liquidity cycle. Yellen took office in 2014, Powell in 2018, Powell was renominated in 2021, and Warsh
Double bottom extension shpz2030Ready to go parabolic once it breaks neckline in the next few days. The first double bottom will take it past neckline of a second double bottom to extend its range with a target at .009. Def one to watch out for when it’s ready to go. Altseason came early this cycle wooo :)
SLong
Silver | Has the Structure Chosen Its Path?⏱️ Reading Time: ~2 minutes
In our previous analysis, we had two possibilities on the table: Wave IV had completed and a new bullish move was beginning, or the larger correction was still unfolding.
Now, the price structure has moved one step further and given us clearer levels to monitor for both scenarios.
🟦 Scenario 1 — Bullish Path
If the recent decline was a Wave 2, the current move could be the beginning of a new impulse.
In this case, a break and sustained move above the bullish conf
Bitcoin 2H | An Impulse at the Crossroads⏱️ Reading Time: ~3 minutes
Hey everyone,
In this 2H Bitcoin update, I’m focusing on one main question:
Is the recent bullish structure still developing as an impulsive pattern, or has that impulse already been completed and the market entered a higher-degree correction?
🟦 Scenario 1 | Bullish Case
In the bullish scenario, as long as price does not enter the territory of Wave 1, the current structure can still be considered a potential Impulse.
One interesting feature of this count is the
🇺🇸 DXY | Short-Term Strength or the Start of a Larger Move? ⏱️ Reading time: about 3 minutes
In this update, we are taking another look at the DXY structure, this time with greater focus on the behavior we are seeing from the U.S. dollar in the short term.
At the moment, significant short-term strength is visible, and price is approaching several important levels marked on the chart.
But from an Elliott Wave perspective, simply seeing price move higher is not enough for us.
The key question is:
Is this advance the beginning of a new bullish structur
I Created a Fear & Comfort Index🟠 Orange = Bitcoin (BTC)
🔵 Blue = Credit Spreads
🟢 Green = U.S. Dollar (USD)
⚪ White = High-Yield Corporate Bonds
🔴 Red = S&P 500
🕯 Candles = M2 Liquidity
This chart is suggesting more downside by following the money.
The dollar is strengthening, M2 liquidity is pulling back, credit spreads are rising, and high-yield bonds are weakening.
In simple terms: liquidity is tightening, credit stress is rising, and investors are becoming less willing to take risk.
Instead of just watching Bitcoin pr
Gold: Listening to the Structure Behind the Next Move⏱️ Reading Time: ~2 minutes
Bullish and Bearish Scenarios | Elliott Wave Principle
At the current stage, two primary structures remain under consideration. The key point is that price structure must determine which scenario gains greater validity, rather than direction alone.
🟦 Bullish Case
The market may be completing a corrective structure in the form of a Classic Zigzag, with the recent advance representing part of Wave C.
An important observation is that Wave C has so far retraced only
Key Wyckoff Events for Cardano + VolumeThe Wyckoff Method analyzes market cycles through four main phases—Accumulation, Markup, Distribution, and Markdown—driven by institutional "smart money". It uses five distinct phases (A-E) and specific events like Buying/Selling Climaxes and Springs to identify entry/exit points, acting on the laws of supply/demand and cause/effect
Key Wyckoff Events
PS (Preliminary Support/Supply): Initial attempt to stop the trend.
SC (Selling Climax) / BC (Buying Climax): Intense buying/selling pressure.
A
USA stock market downtrand will begin at the end of May 2026?!📊 10-year US bonds: why the whole money market is watching them?
If we simplify it to the most important thing, the US 10Y Treasury Yield is the main “base” of the value of money in the world. This is not just a number for economists! This is the level on which depend: mortgages in the US, business loans, stock valuations (especially the tech sector), capital inflow/outflow from the stock market.
That is, in fact, the yield on these bonds is a “thermometer of fear and the value of money.”
T
Crude Oil: Nested Structure?⏱️ Reading Time: ~3 minutes
From an Elliott Wave perspective, crude oil appears to have entered a large corrective structure following Wave (I). At this stage, the broader correction is being considered as Wave (II).
However, recent price action raises an important possibility: the market may be developing a nested structure across multiple degrees within this correction.
Bullish Scenario
Under the first scenario, the current structure may consist of a series of nested 1-2 structures across
Episode 08 — The Architecture Behind the Waves🎬 Mr. Nobody’s Chronicle
Season I — The History of Elliott Wave Principle
Episode 08 — The Architecture Behind the Waves
⏱️ Reading time: ~3 minutes
“When we discover the language of a pattern, the next question is: How is it built?”
In the previous episode, we reached one of the most recognizable ideas behind the Wave Principle:
Five waves in the direction of the main movement...
and three waves in the corrective direction.
But one important question remained.
Do all waves have the same ch
🇪🇺🇺🇸 EUR/USD 3H | When Structure Gets Complex🇪🇺🇺🇸 EUR/USD 3H | When Structure Gets Complex, the Path Is Not Always Straight 🌀
⏱️ Reading time: about 3 minutes
Following our weekly EUR/USD analysis, we are now moving closer to the 3-hour chart to examine what the current structure may be building at the lower degree.
At this stage, the bearish scenario carries more weight, and a continuation of the downward move remains one of the important structural possibilities.
Within this scenario, the current structure may be developing as a Leadi
Silver | One Structure, Two Possible Paths⏱️ Reading time: about 3 minutes
Following our previous Silver analyses, this time we are looking at the chart from the perspective of the previous high, allowing the relationship between the larger historical structure and the current movement to become clearer.
In this view, we have been tracking a larger corrective structure from the previous high, with the possibility of a Wave IV developing. In the lower part of the chart, a Leading Diagonal followed by a Simple Zigzag has also been ident
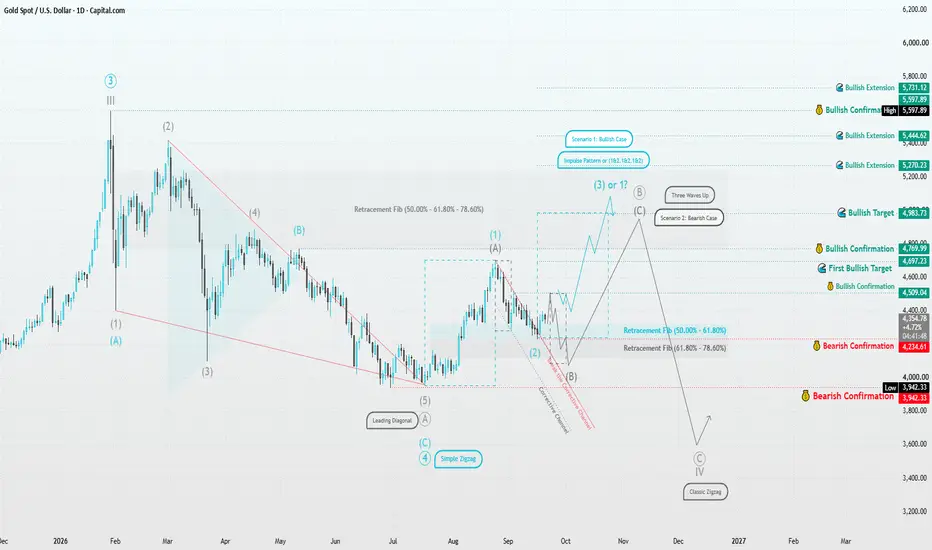
Gold | Structure Before Direction⏱️ Reading Time: ~2 minutes
In the daily timeframe, Gold’s current structure can be viewed from two perspectives. The recent move from around 3,942 may represent the beginning of a new bullish motive structure, while the current decline could potentially be Wave (2) if the 4,234–4,509 area continues to hold.
🔵 Bullish Scenario
What matters is not simply whether price rises, but whether the market develops a valid five-wave motive structure from this area. A move above 4,697, followed by 4,769
DASHUSDT: Weekly Re-Accumulation and Daily Nested Wave 3 Setup⚛️
DASH is one of the stronger higher-timeframe continuation structures on my watchlist.
The weekly chart is holding the W imbalance and the 200 EMA cloud after a major reversal off the lows. That pullback did not destroy the recovery. It created a higher-timeframe re-accumulation zone, and price is now back above the key weekly EMA structure.
Relative strength is also doing its job. DASH is outperforming both BTC and ETH across the short, medium, and longer-term windows. This is not just