RIVER/USDT – Spot Buy Setup!Hey Traders!
If you’re finding value in this analysis, smash that 👍 and hit Follow for high-accuracy trade setups that actually deliver!
RIVER has been trading inside a descending channel and is now approaching a major demand zone. Price is showing signs of base formation, and a breakout from this structure could trigger a strong upside move 🚀
🟢 Spot Buy Zone:
➡️ Around current levels (as shown on chart)
🎯 Upside Targets:
Mid-term: 40–60%+ potential if momentum sustains
Long-term: 300-400% potential
🔴 Risk:
If price loses the marked support zone, expect further consolidation before the next move.
📌 Strategy:
Accumulate in parts
Patience is key
Ideal for spot holders, not over-leveraged trades
Market rewards those who wait ⏳
What’s your view on this?
Share your thoughts in the comments below 👇
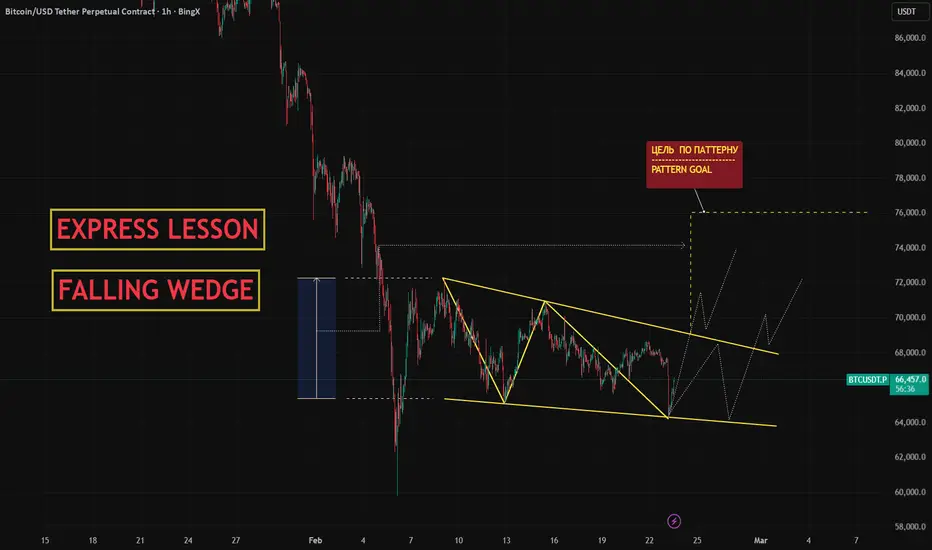
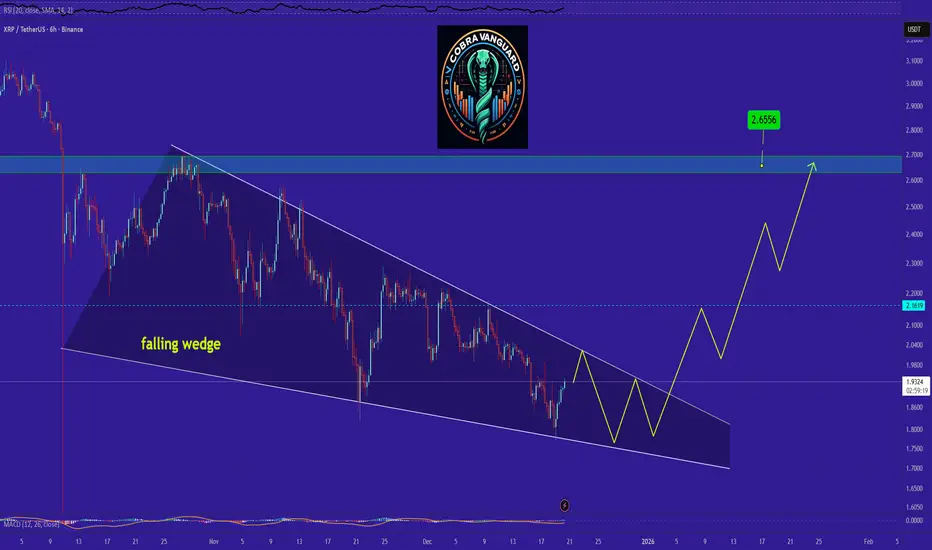
Falling Wedge
The "Falling Wedge" Pattern — GuideToday's mini-lesson is on the "Falling Wedge" pattern, one of the most interesting reversal patterns.
➡️ What is it and what does it look like?
It's a narrowing downward channel where the price makes lower lows, but the highs are dropping even faster. Two descending lines — support and resistance — converge:
▪️Upper line (resistance): Steeper.
▪️Lower line (support): Shallower.
Visually, it's a "triangle," but with a clear downward slope on both sides. It forms at the end of a downtrend.
➡️ Market Logic: Why is this a reversal?
This is a pessimism trap. The fall inside the wedge looks like a trend continuation, but each downward step happens on decreasing volume — sellers are exhausting themselves. Buyers gradually start absorbing the supply. When the last bear has closed their position, there's almost no resistance left — a sharp bounce upwards begins. The pattern signals that selling pressure has been exhausted.
➡️ Key Identification Rules:
▪️A clear downward slope on both converging lines.
▪️Minimum 2-3 touches on each boundary to confirm the shape.
▪️Decreasing trading volume as the price moves towards the end of the wedge — a key indicator of seller exhaustion.
▪️The breakout almost always happens through the UPPER line (resistance), confirming the reversal.
➡️ Trading Plan: How to act?
Do NOT sell inside the wedge! The downward movement is deceptive.
▪️Buy Entry Signal: A candle closes above the upper (resistance) line of the wedge.
▪️Ideal Entry Point: A retest of the broken resistance line, which now acts as support.
▪️Stop-Loss: Place it below the wedge's lower line or below the last low within it.
▪️Target (Take Profit): The minimum target is equal to the height of the wedge's base (at its widest part), projected upwards from the breakout point.
➡️ Key Takeaways:
▪️Essence: A bullish reversal pattern that forms during a downtrend.
▪️Main Sign: Downward movement on declining volume.
▪️Target: ≈ height of the wedge's base.
👉 Look for this pattern after prolonged downtrends.
💡 My Strategy:
When the price approaches a potential entry point, I follow a clear algorithm. No pending orders — only alerts for the approach and manual control.
➡️ Here's what I do at that moment:
▪️I look at the RSI (5min relative to 60min). If the indicator is in the oversold zone, it's a signal to pay attention. If not — I skip it and wait further.
▪️I draw a trend line on the RSI itself along the local "HIGHS" (or lows, depending on the trade direction).
▪️I wait for a breakout of this trend line. Once the line is broken, I bring in the rest of my arsenal.
➡️ I check a combination of indicators:
▪️At least two oscillators have changed color to green/red.
▪️Whales have exited their sells/buys.
▪️A buyer/seller impulse has appeared.
▪️If a Pump/Dump signal was received earlier, that's a huge positive factor for me.
➡️ Why is this important?
RSI gives me the first signal, but I only make a decision based on a confluence of factors. RSI without confirmation leads to a false entry. RSI + oscillators + whales + impulse = 95% probability that the trade will be profitable.
It is this comprehensive approach that allows me to enter at the moment of maximum momentum, catch the best price, and trade with the most favorable leverage.
Those who have been with me for a while have seen the results and the win rate. I recommend you adopt this approach! 🎯
Profit to everyone! 🚀
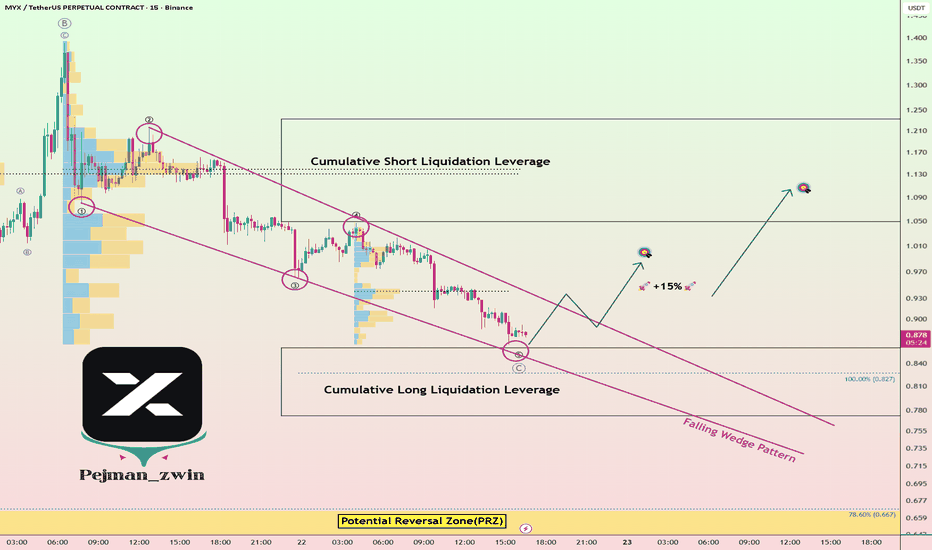
MYX Is Coiling… The Trigger Is Closer Than It LooksToday I want to share my MYX ( BINANCE:MYXUSDT.P ) token analysis on the 15-minute timeframe. It can act as a signal, but always follow proper risk & capital management.
MYX is currently trading near the lower line of a Falling Wedge pattern, while also moving around the Cumulative Long Liquidation Leverage($0.860-$0.773).
From an Elliott Wave perspective, it looks like MYX may be completing microwave 5 of the main wave C.
I expect that after breaking above the wedge’s upper line, MYX could rally at least +15%.
Cumulative Short Liquidation Leverage: $1.049-$1.232
First Target: $0.977
Second Target: $1.091
Stop Loss(SL): $0.770(Worst)/$0.817
Points may shift as the market evolves
What’s your opinion on the MYX Finance project?
Note: Because trading volume is usually lower on Saturday and Sunday, the main move may happen late Sunday.
💡 Please respect each other's opinions and express agreement or disagreement politely.
📌MYX Finance Analysis (MYXUSDT.P), 15-minute time frame.
🛑 Always set a Stop Loss(SL) for every position you open.
✅ This is just my idea; I’d love to see your thoughts too!
🔥 If you find it helpful, please BOOST this post and share it with your friends.
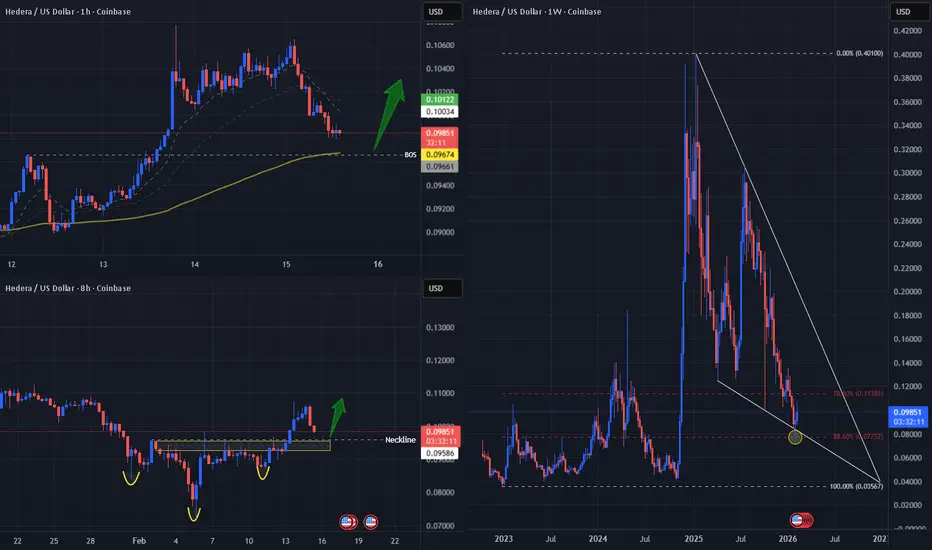
Hedera Giving A Multi-Timeframe Showdown, Time To Buy?!COINBASE:HBARUSD in a Multi-Timeframe Analysis is giving some insight and clues that the current Bullish rally may just be beginning! Let's break it down.
- When looking at the Weekly chart, we can see that if we take a Fibonacci Retracement Tool and go from the Low @ .03567 to the High @ .40100, we can see price on COINBASE:HBARUSD makes a Retracement to the 88.6% Fibonacci Level and a 3rd test of the Falling Support which is part of a bigger pattern, the Falling Wedge.
*This Retracement could mean the end of the Bearish decline!
- On the 8Hr chart we can see price has formed an Inverse Head and Shoulders Pattern, a Bullish Reversal pattern that with a valid Breakout and successful Retest of the Neckline can generate Long Opportunities in price!
*Currently price seems to be making a pullback to that Breakout of the Neckline for the Retest!
- Lastly, the Hourly chart shows that the 200 EMA is sitting right in the area of the Neckline which could serve as great Support for price on the decline. It also aligns great with the Break of Structure that happens with the Neckline serving as a great place to Retest!
Fundamentally, FedEx joining the Hedera Governing Council "signaling deeper enterprise integration and expanding institutional credibility for the network", sees serious support coming in for COINBASE:HBARUSD !
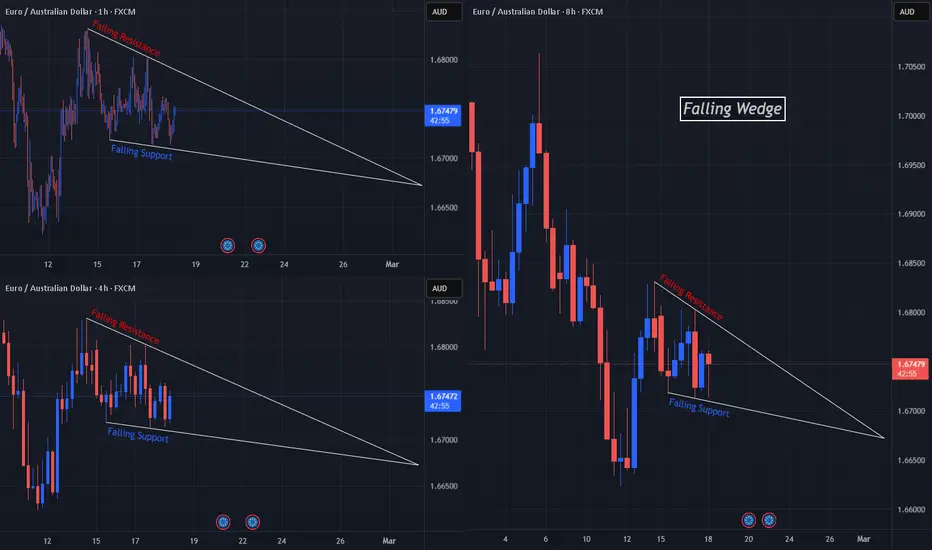
Are EA Bulls "Wedging" Into Price??OANDA:EURAUD price action has fallen into a Consolidation since the week has started and its beginning to form what looks to be a Falling Wedge!
A Falling Wedge is formed by Lower Highs and Lower Lows and depending upon where it forms, can be traded as a Reversal or Continuation pattern.
- Here in this case with it forming at a Low of a Downtrend, we can assume a Reversal may be happening.
Nonetheless, we must wait for a valid Breakout and successful Retest of either the Falling Resistance or Falling Support to generate any Long or Short opportunities.
**Note: Triangle patterns are known to fail 1/3 of the time so be prepared for any False Breakouts due to Fundamental or Geopolitical influences!!
ASTER Wedge Breakout — +20% Upside Before the Unlock ShockAs the crypto market stumbles, ASTER ( BINANCE:ASTERUSDT ) defies gravity with a 30%+ surge in the past week, fueled by hype around its privacy-focused Layer-1 mainnet launch in March 2026. Backed by Binance's CZ, this DEX powerhouse is channeling 80% of fees into token buybacks, tightening supply amid record perp volumes. But with a massive 78-164M token unlock on Feb 17 looming, analysts are split—will the rally fizzle or rocket to +$1.00?
Key Fundamental Analysis:
Project Overview:
ASTER is a next-gen decentralized perpetual exchange (DEX) merging Astherus and APX Finance in 2024. It offers non-custodial trading with privacy features, multi-chain support (BNB, ETH, SOL, ARB), high leverage (up to 1001x), and yield-bearing collateral like asBNB/USDF. Focus: Privacy, deep liquidity, and bridging TradFi with DeFi via RWAs.
Recent Price Pump Reasons:
+3.5% in 24h to $0.7106 (market cap $1.74B). Driven by mainnet announcement (Feb 12), Stage 6 buyback program (started Feb 4, auto daily buys with 40% fees), Binance Wallet partnership for on-chain perps, $50K airdrop (Feb 13-20), and whale accumulation amid market weakness. DEX volumes hit $4.1B/24h, signaling real demand.
Tokenomics & Risks:
Total supply 8B, circulating 2.45B. 80% fees to buybacks/burns (254M bought back, 78M burned). Upcoming: Staking in March post-mainnet. Risk: Feb 17 unlock (0.98-6.6% supply increase, ~$56-115M value) could cause short-term pressure, despite buyback buffers.
2026 Roadmap:
Q1 mainnet launch (Aster Chain: scalable, ZK-privacy L1), staking/governance, fiat ramps, RWA perps expansion. This shifts ASTER from app to ecosystem token, boosting utility.
Outlook: Rally could sustain to March if mainnet hype builds, but unlock may trigger volatility. Strong fundamentals (CZ backing, volumes) suggest long-term upside; watch OI ($357M+) and funding rates for signals.
----------------------------
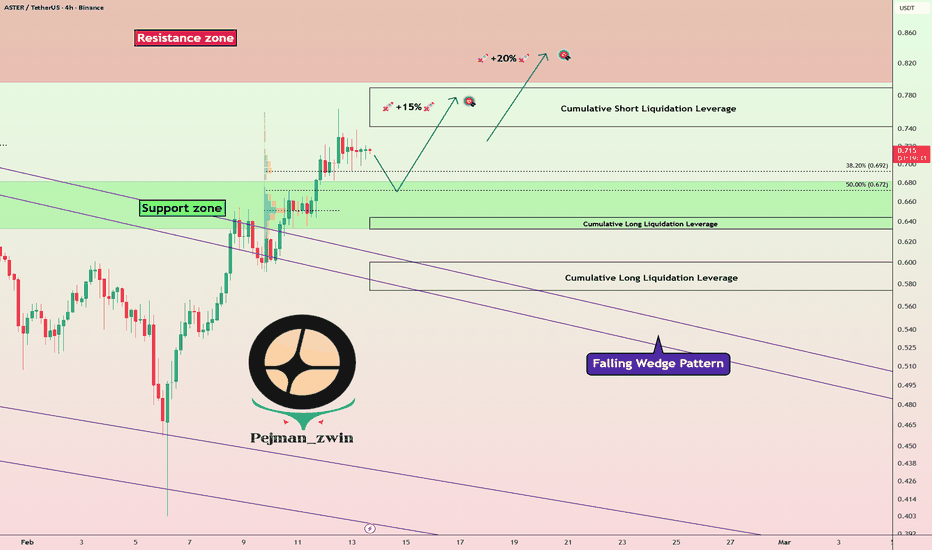
Let’s dive into the technical analysis of the ASTER token on the 4-hour timeframe—stick with me. First, looking at the daily timeframe, we can see that ASTER has successfully broken above the upper lines of a falling wedge pattern, signaling a potential continuation of a bullish move from a classical technical perspective.👇
Right now, the ASTER token is hovering above a support zone($0.752-$0.681).
Based on the explanations above, I expect ASTER, as it approaches support zone or Fibonacci levels, to begin rising again and increase by roughly +15 to +20%, at least toward the Cumulative Short Liquidation Leverage($0.789-$0.742).
First Target: $0.736
Second Target: Resistance zone($0.929-$0.796)
Stop Loss(SL): $0.617
Points may shift as the market evolves
Cumulative Long Liquidation Leverage: $0.681-$0.633
Cumulative Long Liquidation Leverage: $0.600-$0.574
What do you think about the ASTER token? Could it continue its bullish run in the coming days, or should we expect a correction? I’d love to hear your opinion!
💡 Please respect each other's opinions and express agreement or disagreement politely.
📌 Aster Analyze (ASTERUSDT), 4-hour time frame.
🛑 Always set a Stop Loss(SL) for every position you open.
✅ This is just my idea; I’d love to see your thoughts too!
🔥 If you find it helpful, please BOOST this post and share it with your friends.
GJ Delivers Valid Breakout After False OneThis week has been nothing but Consolidation for OANDA:GBPJPY but today we finally get a Valid Breakout of the Falling Wedge!
A Falling Wedge consists of price trading between Lower Highs and Lower Lows and can be considered a Continuation or Reversal pattern dependent upon at what level the pattern is forming.
Monday, Bulls attempted to make a Breakout of the Falling Resistance but turned false once price fell right back down into the pattern and tested it as Resistance again and succeeded!
This morning, price has delivered what seems to be a Valid Bearish Breakout of the Falling Support but price seems to be exhausted which means we could be looking for a Retest of the Breakout.
If the Retest of the Breakout is successful, this could generate Short Opportunities to take price further down!
Fundamentally, we see strength come in for JPY with the Prime Minister Sanae Takaichi's election victory.
"Analysts also noted that Takaichi’s policy, which includes tax cuts and more fiscal spending, is expected to boost the economy and lift the stock market, potentially prompting the Bank of Japan to take a more hawkish stance, all factors that could support the yen."
- tradingview.com/news/reuters.com,2026:newsml_L6N3Z60OK:0-yen-extends-gains-after-takaichi-election-victory-us-data-in-focus/
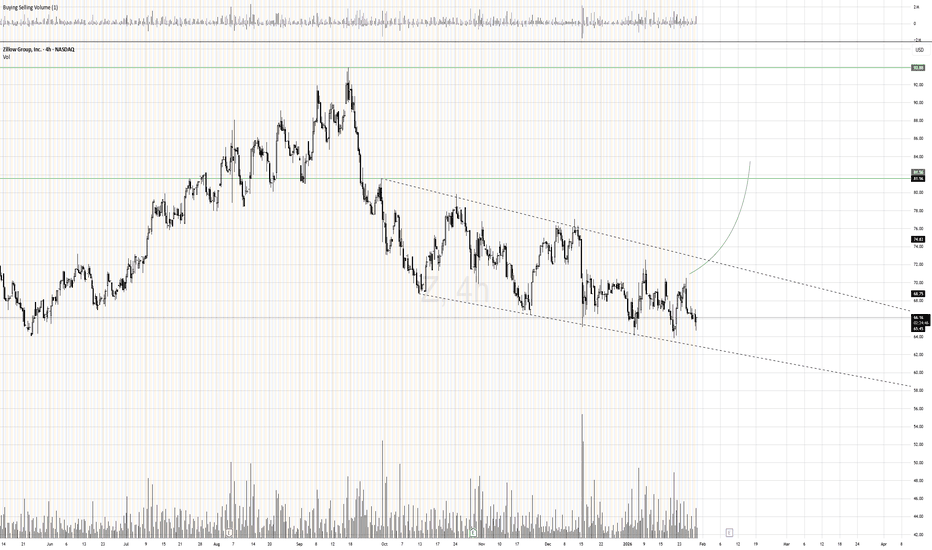
Falling wedge pattern on zillow!OptionsMastery:
🔉Sound on!🔉
📣Make sure to watch fullscreen!📣
Thank you as always for watching my videos. I hope that you learned something very educational! Please feel free to like, share, and comment on this post. Remember only risk what you are willing to lose. Trading is very risky but it can change your life!
SOL 1W: Accumulation Range + Falling Wedge — Push to Range High Timeframe: 1W (SOLUSDT.P)
Macro context:
SOL has been trading inside a well-defined range (market in balance), with price repeatedly rotating between a lower demand zone (range low) and an upper supply zone (range high). Multiple reactions on both sides reinforce the idea that this is an accumulation/distribution-type structure rather than a clean trend.
Range thesis (accumulation behavior):
As long as price remains inside the box, the highest-probability behavior is rotation:
• Buyers defend the lower boundary (bounces / absorption)
• Sellers defend the upper boundary (rejections / supply)
Pattern inside the range: Falling wedge (compression):
On the right side, price is compressing into a falling wedge (lower highs, tightening structure). Often this can be an exhaustion pattern that breaks upward, but it can also fail if the breakout lacks acceptance—leading to a deeper correction toward the lower range support.
⸻
Key scenarios
Scenario A — Rotation to the range high (bullish if acceptance shows)
If the range low continues to hold and SOL starts reclaiming structure, a rotation toward the upper range supply becomes the natural path.
What I want to see (confirmations):
• Stronger weekly closes off the lower range area
• Reclaim + hold of reclaimed levels as support (successful retest)
• Break and acceptance above the wedge’s upper trendline
Scenario B — Deeper correction (if the wedge rejects / reclaim fails)
If price rejects at the wedge’s upper trendline or fails to regain structure, probability increases for:
• A move back toward the lower range demand (and possibly a deeper sweep before a real bounce)
Invalidation (for the bullish rotation idea):
• A clean weekly breakdown below the lower range demand zone (acceptance below the range)
⸻
Note: This is a macro roadmap, not a market order. I’m watching for weekly confirmation (acceptance vs. rejection) to decide whether this becomes a range-high rotation or a deeper correction setup.
ALong
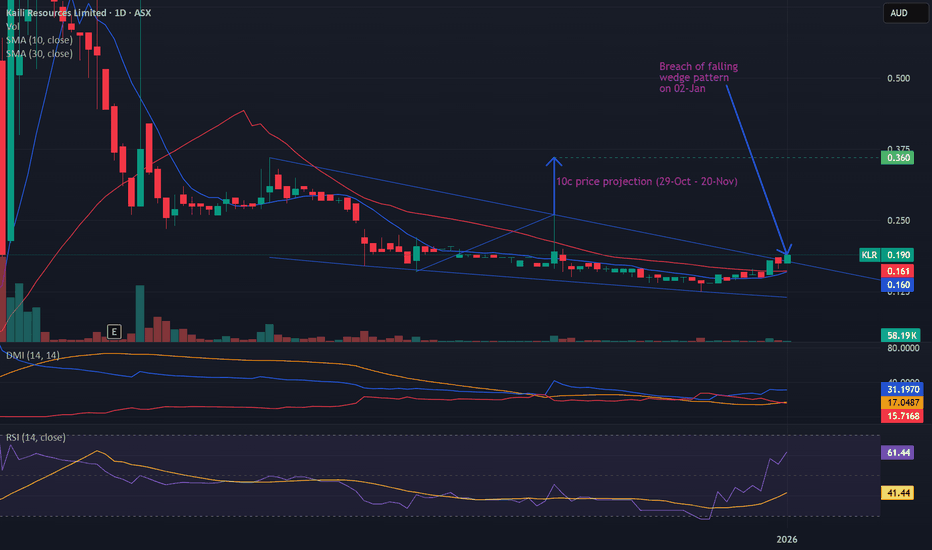
Bullish potential detected for KLREntry conditions:
(i) higher share price for ASX:KLR along with swing up of indicators such as DMI/RSI, and
(ii) observing market reaction around the $0.19 resistance area from 21st November.
Depending on risk tolerance, the stop loss for the trade would be:
(i) below the potentially rising 30 day MA (currently $0.161), or
(ii) below the recent swing low of $0.15 of 29th December, or
(iii) below the ultimate swing low of $0.125 of 15th December.
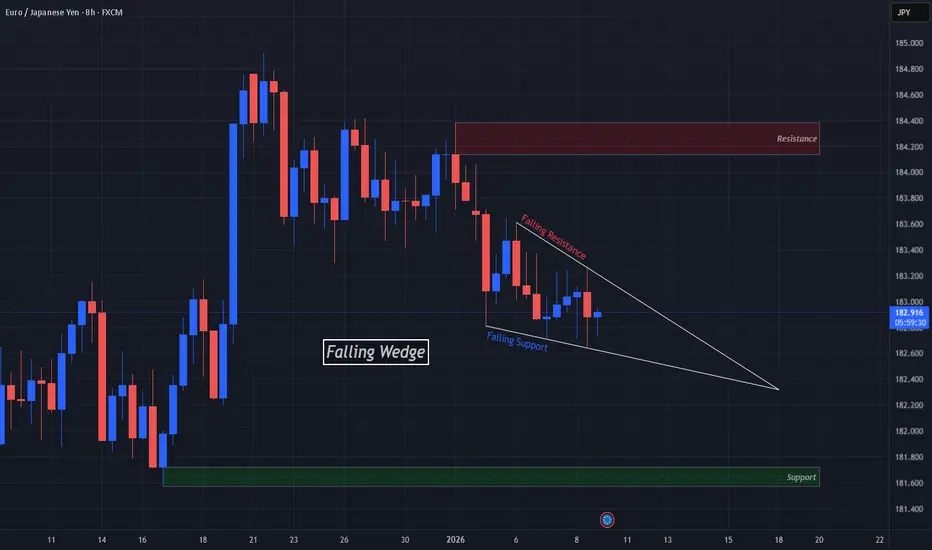
EJ Falls Into A WedgeOANDA:EURJPY has formed a Falling Wedge with Lower Highs into Lower Lows!
Price has tested the Falling Support three times with the Falling Resistance, so far, only tested twice.
Typically a Falling Wedge delivers a Bearish Breakout with price falling to the downside!
If price does make a rise, we should look for it to make a third test of the Falling Resistance and if successfully rejected, we could see price drop back to the Falling Support.
Regardless, once price makes a valid Breakout of either leg and Retests, this will generate trade opportunities to take to either the Overhead Resistance or Underlying Support levels!
BITF - when structure starts to matter more than headlinesBitfarms Ltd. is a publicly traded Bitcoin mining company operating large scale mining facilities across North and South America. The core business is cryptocurrency mining with a strong focus on energy efficiency, infrastructure ownership, and geographic diversification across Canada, the United States, Argentina, and Paraguay.
From a fundamental perspective as of late 2025, Bitfarms remains a growth focused company still in its investment phase. The upcoming Q4 2025 report is expected to show EPS around −0.04 USD with projected revenue near 66.45M USD. Throughout 2025, quarterly revenue has remained relatively stable in the 69–78M USD range, driven primarily by the cryptocurrency mining segment. Cash flows remain volatile and free cash flow is still negative, which is typical for miners actively expanding capacity and upgrading infrastructure. This is not a dividend or value story, but a leveraged bet on scale, efficiency, and the broader crypto market cycle.
Technically, the structure is clean and well defined. On the 4 hour chart, price formed a falling wedge that has already broken to the upside with a clear and confirmed retest. The breakout held, sellers failed to push price back inside the pattern, and momentum stabilized. All previously existing gaps have now been fully closed, reducing downside risk from unfinished price imbalances. Price is currently sitting on a strong daily support zone, while the working timeframe remains the 4 hour chart. Higher timeframe structure confirms support validity, and price action shows early accumulation behavior.
From a tactical standpoint, Bitfarms is transitioning from a corrective phase into a potential new impulse. As long as price holds the current support zone, the path opens toward the 3.91 area. If the broader structure remains intact and crypto sentiment stays constructive, continuation toward the 6.60 zone becomes technically justified. This is not a short term hype trade, but a structured continuation setup after a confirmed breakout and retest.
Sometimes the market clears all unfinished business first, and only then starts the real move. .
UDMY turning profitable and in deep value territoryNASDAQ:UDMY stock has been left for dead. It's formed a massive falling wedge on the monthly chart and until late has done so with improving momentum.
While not strictly aligned to disciplined charting techniques I view the recent meltdown in momentum as capitulation and a good time to start a small position.
Looking at the annual and quarterly profit figures we can see the company has been bleeding cash for years, but in recent quarters is starting to make a small profit.
It's a speculative buy, so keep the position sizing small, but I think there's room to double or even triple with sufficient time.
ULong
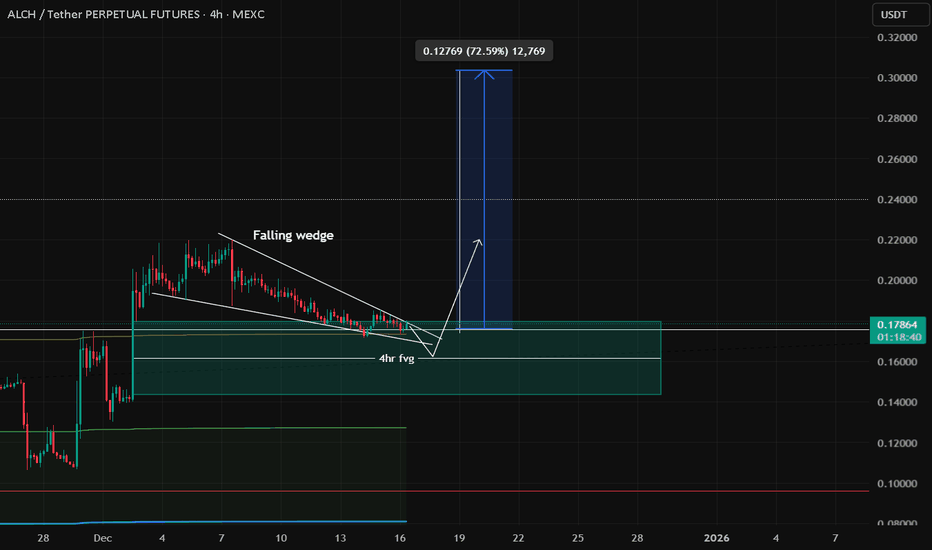
ALCHUSDT – 4H trade ideaPrice is currently forming a bullish falling wedge, with liquidity resting at the 4H FVG below.
Based on the Total Market Cap context, I’m expecting a potential AMD scenario:
Possible wick down into the 4H FVG
Followed by a bullish breakout from the falling wedge
Price is consolidating above the Monthly VWAP, which supports the bullish bias.
If we see confirmation after the sweep, continuation towards higher levels becomes likely.
➡️ Check the weekly analysis for higher timeframe context.
Ascending Channel | Golden Zone Retracement SetupAfter analyzing the chart on the 2-hour timeframe, price action has been moving within a well-defined ascending channel since Tuesday, 25 November 2025. The upper boundary of the channel has been consistently respected, confirming the strength and validity of this bullish structure.
Following a rejection from the upper boundary, price is currently trading around 1.17403. At this stage, the market appears to be developing a bearish corrective structure, resembling either an upper flag formation or a falling broadening wedge, which is still in progress and not yet completed.
Based on this structure and overall market behavior, we anticipate a potential retracement toward the Fibonacci Golden Zone, which aligns with our projected price target. This area may act as a key decision zone for the next directional move, especially if supported by price action confirmation and volume reaction.
Traders should monitor price behavior closely around the channel boundaries and Fibonacci levels for high-probability setups.
Happy Trading
SpicyPips
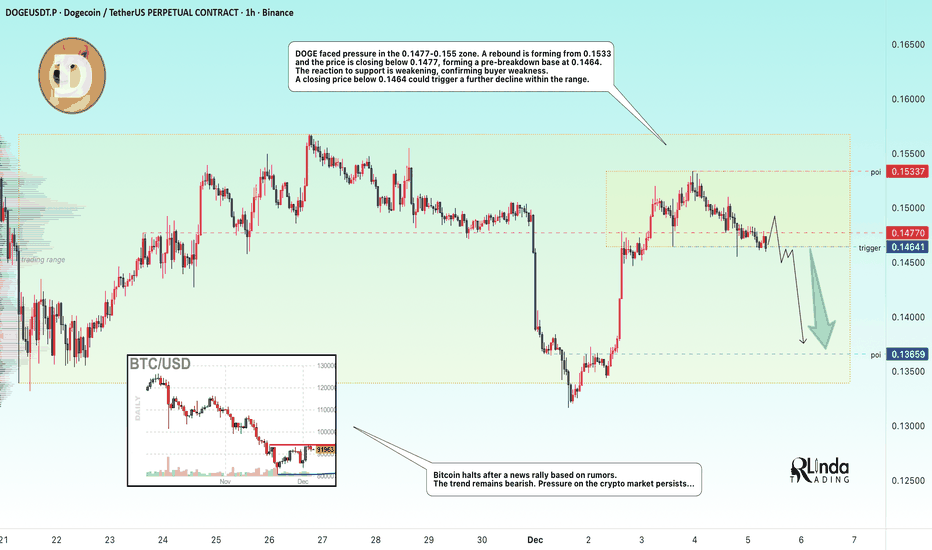
DOGEUSDT → Lack of bullish potential BINANCE:DOGEUSDT.P failed to break the trend. Under pressure from resistance and a global downtrend, the coin is reversing and may decline...
Bitcoin is pausing after a news rally based on rumors. The trend remains bearish. Pressure on the crypto market is present...
DOGE faced pressure in the 0.1477 - 0.155 zone. A rebound from 0.1533 is forming and the price is closing below 0.1477, forming a pre-breakout base of 0.1464. The reaction to support is weakening, confirming the weakness of the buyer. A close below 0.1464 could trigger a further decline within the range.
Resistance levels: 0.1477, 0.15337
Support levels: 0.1464, 0.1366
A breakdown of support, closing below the level, and consolidation in the short zone will once again confirm buyer weakness, which in turn may trigger a further decline.
Best regards, R. Linda!
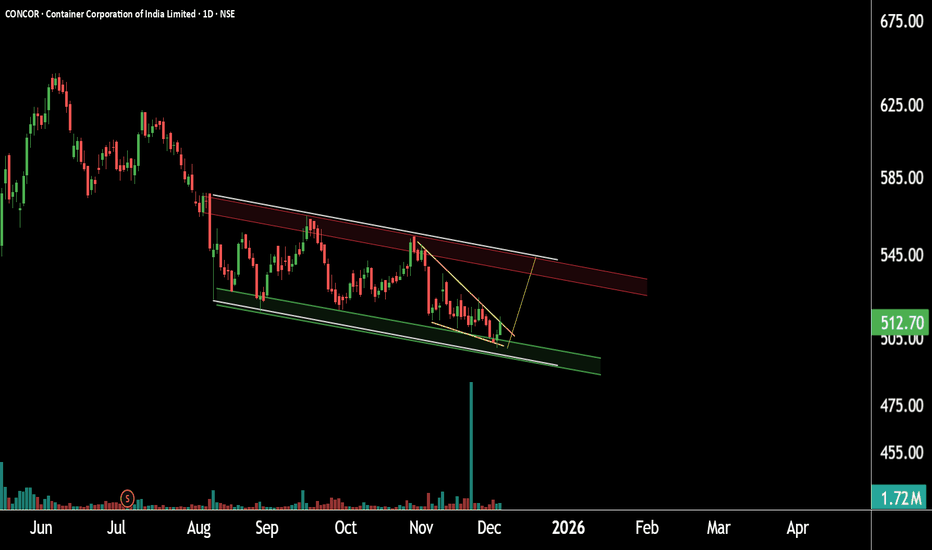
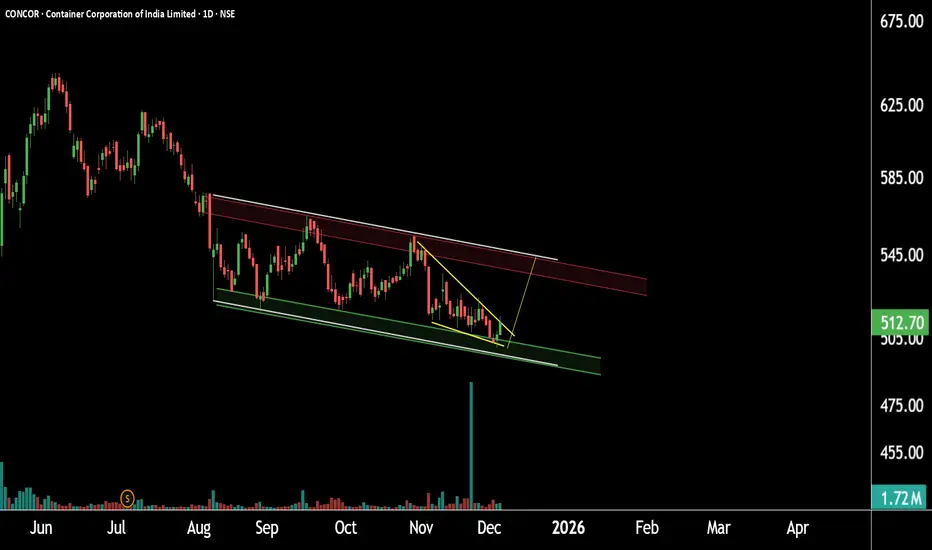
Concor Ready for Support Reversal ?This is the daily timeframe chart of Concor.
The stock is trading within a falling channel pattern, with a strong support zone around 490–510.
On the shorter timeframe, the structure is forming a falling wedge near the 500–510 area. If this support zone holds,
the stock may witness a potential upside toward 540.
Thank you.
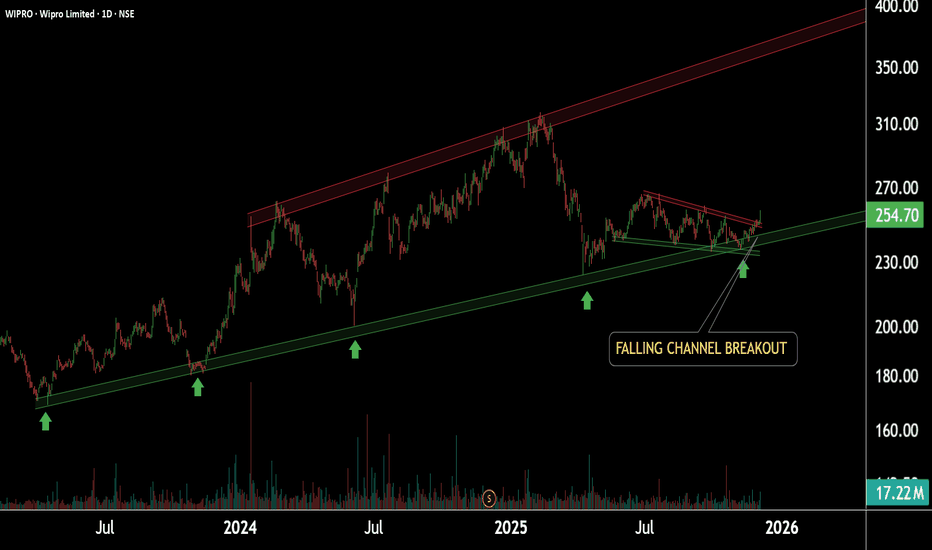
Wipro: Breakout & Boom!This is the daily timeframe chart of Wipro.
Wipro has been forming a falling wedge pattern, and the stock has given a breakout near the ₹250 level.
The breakout has also occurred above the long-term support zone of ₹225–₹240, which strengthens the bullish structure.
If this momentum continues, then any dips from the current levels may offer strong risk-reward opportunities and potentially lead to a bigger rally.
In the shorter timeframe, the potential upside target for Wipro stands near the ₹280 level..
Thank you.
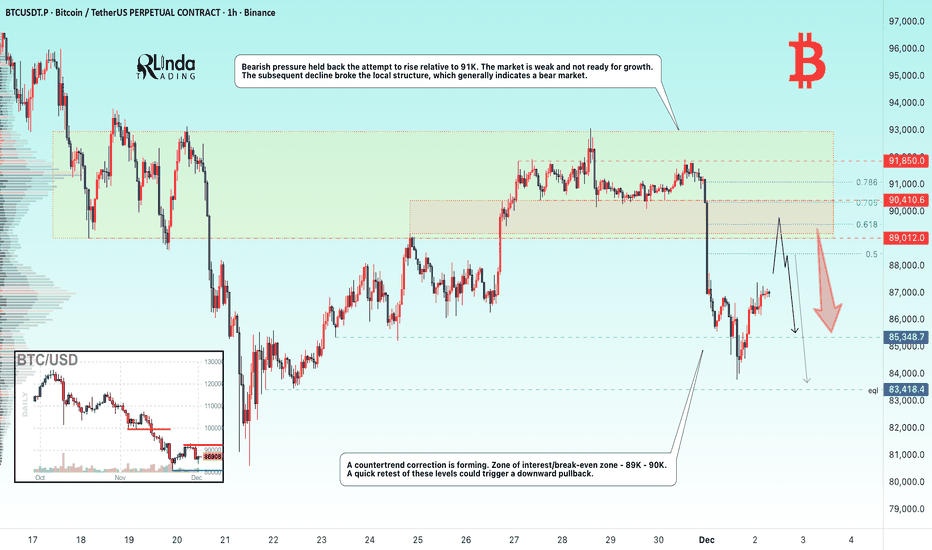
BITCOIN → The hunt for liquidity before the fallBINANCE:BTCUSDT.P continues to update lows within the global downtrend. The retest of 91K confirmed the dominance of bears...
The downtrend continues. The technical and fundamental situation for the crypto market is neutral to weak.
Bearish pressure held back the attempt to rise relative to 91K. The market is weak and not ready for growth. The subsequent decline broke the local structure, which generally indicates a bear market, but after updating the local minimum to 83700, a countertrend correction is forming. Zone of interest/break-even zone - 89K - 90K. A quick retest of these levels could trigger a downward pullback.
Resistance levels: 89K, 90K
Support levels: 85,400, 83,400
A retest of the range boundary and zone of interest could trigger a liquidity squeeze and a further decline if the bears keep the price below these boundaries.
Best regards, R. Linda!
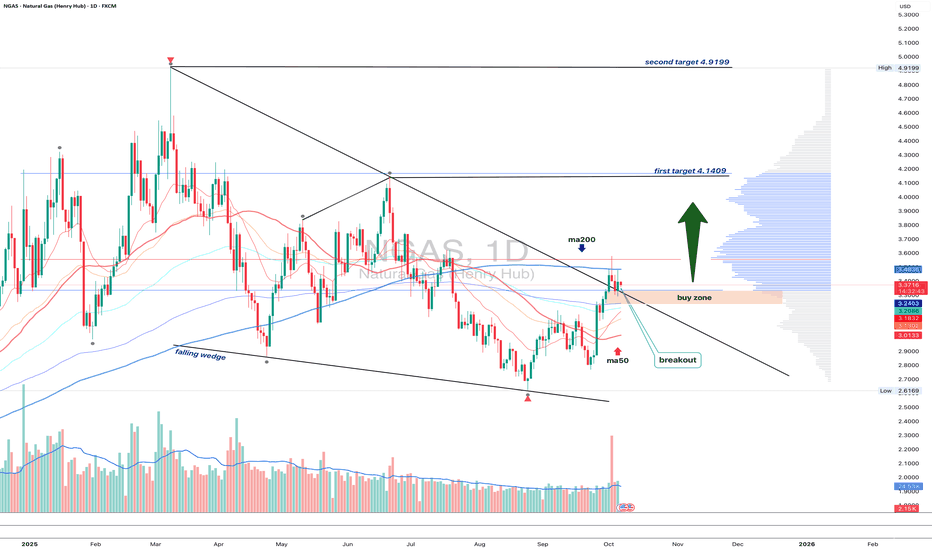
NGAS 1D - bulls waiting for the green lightOn the daily chart, Natural Gas has broken out of a falling wedge, but price remains below the MA200, while EMA still hovers above it - a mixed signal showing short-term hesitation within a longer-term downtrend.
The 3.10–3.20 buy zone remains key - that’s where the retest area aligns with short-term support. If buyers can reclaim the EMA and push above the MA200, the next upside targets are 4.14 and then 4.92.
Volume on the breakout supports growing bullish interest, while fundamentals - like rising seasonal demand - may soon add more fuel to the move.
Tactically , watch how price behaves near MA200. Once EMA flips back on top, momentum could accelerate fast. Until then, the market’s like a gas burner waiting for that click - ignition pending