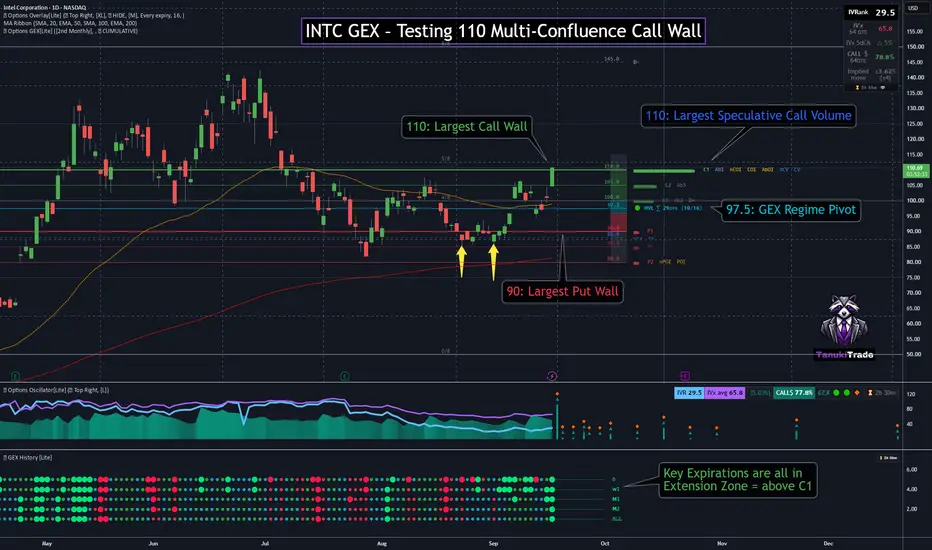
INTC GEX – Testing 110 Multi-Confluence Call WallINTC is pressing into 110 on the daily chart after a strong momentum expansion. Spot is only marginally above the level, so this remains a test rather than confirmed acceptance.
The October 16 cumulative GEX profile makes 110 the central decision point. It is the highest call wall and also overlaps a technically important reaction area visible on the daily chart.
🔶 Regime Context 🔶
With price above the 97.5 HVL and the 100 call-cluster boundary, INTC remains in a positive GEX regime.
GEX History shows 0, W1, M1, M2, and ALL aligned in large-green positive extension. This is a dampening-volatility backdrop rather than a directional signal. The current momentum candle is testing C1, but acceptance still requires a sustained hold above 110.
🔶 Options Structure Context 🔶
👉 110 – C1 multi-confluence wall
Confluence at 110:
C1 — highest call NETGEX
Ab1 — largest absolute gamma
nCOI / COI / AbOI — dominant call and absolute open-interest concentration
CV / PV — largest cumulative call- and put-volume peaks
This makes 110 a major reaction zone rather than merely a round-number resistance. Since both call and put volume peak here, the volume concentration is two-sided and should not be treated as a standalone bullish flow signal.
🔶 Key Structure to Watch 🔶
Above 110 — sustained acceptance keeps INTC in positive extension, with gamma squeeze potential toward the 115 and 120 secondary NETGEX references
Below 110 — rejection returns price toward 105, followed by the 100 call-cluster boundary
97.5 — HVL and GEX regime pivot
90 — strongest put wall (P1)
For now, 110 is where the technical structure, C1, absolute gamma, open interest, and volume all meet.
The key question is whether INTC can turn 110 from resistance into support—or whether this extension test ends in rejection. SPX gamma map — Sep 14: below the 7671 flip, 7800 call wallSPX opens near 7657, about 0.8% below the all-expiries gamma flip at ~7671, in an amplifying regime: net dealer gamma from open interest is deeply negative. VIX 17.6 (+11% overnight), expected move about ±0.43%. No US data today; Fed decision Wednesday, quarterly expiry Friday.
Key levels (index prices, lines on the chart): call wall / resistance 7800 (red) is the structural cap, with OI magnets stacked at 7750, 7775 and 7790 on the way up. The prior-session call wall at 7710 is still backed by positive gamma. Two GEX magnets sit right above the flip at 7675 and 7680 — the first resistance cluster. HVL / gamma flip 7671 (orange). 1-day cone 7625–7690 (grey). No put support today: the structural put wall sits ~14% below spot and is negligible; below the 7600-area negative-gamma pocket, the next accelerator is 7500.
Bull case: a sustained reclaim of 7671–7680 flips the regime back toward dampening; the 7690 cone top and the 7710 prior call wall are the next tests, with magnets up to 7800.
Bear case: while price holds below the flip, dealer hedging works with the move rather than against it; 7625 (cone low) is the first marker, then the 7600 pocket accelerates toward 7550 and the 7500 pocket.
Monday lesson — why the opening side of the HVL matters: the HVL is where cumulative dealer gamma changes sign. Above it, dealers sell rallies and buy dips, so moves get dampened; below it they do the opposite and moves get amplified. Opening below the flip, as today, means the same 20-point move carries more momentum, so a reclaim of the flip is the single event that changes the whole read of the session.
Levels are a map of dealer positioning, not a prediction. Not investment advice. INTC – Bounce from 85 Put Wall, Watching 100 Call WallINTC is bouncing off the 85 put wall on the daily chart, with price now holding near 95.61 after reclaiming the 90 HVL. On the October 16 cumulative GEX Profile, that keeps INTC in a positive GEX regime (spot above HVL) and inside the call cluster above 93 (cTrans). The 100 call wall is still overhead — this is not yet a positive-extension story on that swing profile.
🔶 Regime Context 🔶
Price is trading above HVL at 90 , so the regime read is positive. GEX History on the daily is an all-green map, but size splits the story : the shortest two rows (0 and W1) print large green — those front expirations are in positive extension, consistent with spot already through their call walls near 95. M1, M2, and ALL stay smaller green : positive gamma, not through the 100 C1 of the October 16 cumulative map. That is not all-expiry extension confluence. The path still matters — the panel shifted out of a broad red stretch as price bounced from 85. That bounce is the momentum confirmation so far; 100 is where the next confirmation is required.
🔶 Options Structure Context 🔶
👉 100 – C1 — highest call NETGEX on the October 16 cumulative profile (42 DTE)
Call volume on the October 16 expiry itself also peaks at 100 .
👉 95 – C3 + Ab1 — largest absolute gamma, sitting right under spot
Confluence at 95 (October 16, 42 DTE, cumulative):
C3 — third call wall
Ab1 — largest absolute gamma
D+ — strongest positive delta exposure
That makes 95 a clear reaction zone, not just a round number — price is holding this cluster while stretching toward 100.
👉 110 – C2 — next call wall, and the heavier inventory/flow cluster above C1
Confluence at 110 (October 16, 42 DTE, cumulative):
C2 — second call wall
COI — highest call open interest
AbOI — highest absolute open interest
CV / nCV — strongest call volume (cumulative)
If 100 is accepted, positive extension opens toward 110, with gamma squeeze potential only if momentum holds above C1.
🔶 Downside Structure 🔶
👉 90 – HVL / P3 — regime pivot; must hold for the positive-regime read
👉 85 – P1 — strongest put wall; the bounce origin
Confluence at 85 (October 16, 42 DTE, cumulative):
P1 — strongest put wall
PV / nPV — strongest put volume
Together, this is the put-side reaction zone that launched the bounce.
👉 80 – P2 / POI / nPOI — next put cluster if 85 fails
🔶 Options Sentiment 🔶
CALL$ 66% (42 DTE) means call options at an equivalent distance from spot are priced 66% higher than the corresponding puts — this is call pricing skew .
On the Options Oscillator, the filled green histogram remains elevated on the right edge — call pricing skew is holding at a high level , not fading.
IVRank 22.5
IVx 59.2 (42 DTE)
CALL$ 66% (42 DTE) — call pricing skew
Implied move ±1.76%
🔶 Key Structure to Watch 🔶
100 — C1; the decision for swing-horizon extension
95 — C3 + Ab1; current magnet
90 — HVL; regime pivot
85 — P1; bounce support
For now, INTC is a put-wall bounce holding above HVL, with only the front History rows in extension.
The key question is whether momentum can carry price through 100 — or whether the call wall rejects and sends the test back toward 90. SPX gamma map — Sep 4: 7740-7750 pin into NFP, weekly expiryPre-market snapshot: SPX 7748, positive-gamma (dampening) regime, expected move ±0.68% (about ±53 pts), VIX 14.2, VIX1D 10.8. Net dealer gamma jumped more than 10% overnight. The August jobs report lands at 8:30 ET, an hour before the cash open, so the first hour trades on a print the market has not digested yet: the pre-open checklist is red (macro print pending + spot pinned inside a 10-point cluster) and the map gets reassessed once that first hour is done.
Lines on the chart: call wall 7750 (red), where dealers sell rallies into it, and put support 7740 (green), where hedging buys dips into it. Spot sits between the two, less than 0.15% from either wall.
GEX magnets above form a ladder at 7775, 7800 and 7825 (then 7850 / 7875). The 7825 area shows mixed positioning and can accelerate rather than dampen.
Negative-gamma pocket at 7650 (grey dashed): below it, hedging amplifies moves instead of absorbing them. HVL / gamma flip at 7515 (orange), far below: the structural regime stays dampening while price holds above it. No 1-day cone in today's pre-market set.
Range / pin: as long as 7740-7750 holds after the print, positive gamma favors rotation around the at-the-money cluster rather than a trend day. Sustained trade outside that band once the report is out invalidates the pin.
Upside: a break and hold above 7750 opens the magnet ladder 7775 > 7800 > 7825. Losing 7750 on a retest cancels that read.
Downside: under 7740 the next reference is the 7650 pocket, where dealer hedging speeds the move up instead of slowing it; 7515 would flip the whole regime. Reclaiming 7740 cancels that read.
Friday lesson, weekly expiry: much of the open interest behind today's 7740 / 7750 walls expires this afternoon. When those contracts settle, the gamma they carried disappears and dealers stop hedging them, so walls and magnets are rebuilt from what is left (next-week and monthly strikes). A wall that held all session can simply vanish at the close rather than break, and with Monday a US holiday, Tuesday's map will be drawn from a different positioning base.
Levels are a map of dealer positioning, not a prediction. Not investment advice. SPX gamma map — Sep 3: soft 7660 put wall, 7800 call wall capsSPX cash 7667, with futures about 0.25% above the gamma flip, so the session opens on the dampening (positive-gamma) side. Expected move ±0.66%, VIX 15.2, VIX1D 10.4. Pre-market read: dealer positioning is unchanged since yesterday's close, so this map is inherited structure until the first 0DTE prints rebuild it after the open.
Key levels (index), lines on the chart:
- Call resistance 7800 (red) — structural call wall, dealers sell into rallies here; open-interest magnets above it at 7825 and 7850.
- Put support 7660 (green) — mostly residue of positions that expired yesterday, so treat it as soft; the HVL / gamma flip 7656 (orange) sits right underneath.
- 0DTE negative-gamma accelerator 7665, prior-session call wall 7670, last positive-gamma step 7680.
- Negative-gamma pocket 7685-7700 — an accelerator, not classic resistance; then open-interest magnets at 7715, 7725, 7750 and 7775 before 7800. No 1-day cone in this read.
Scenarios:
- Balance: price stalls in the 7675-7680 positive-gamma cluster and rotates back toward 7670, with 7656 as the floor of the range; acceptance above about 7682 changes that reading.
- Upside: acceptance above 7680 pushes price into the 7685-7700 pocket, where dealer hedging can amplify the move toward the 7715-7725 magnets, then 7750 and 7775, with 7800 as the structural cap.
- Downside: rejection back below 7670 returns price to the 7656-7670 balance; losing 7656 flips the regime to amplifying and exposes the 7650 shelf toward 7600.
Why 0DTE walls migrate during the session: a wall is only as solid as the open interest behind it, and on a 0DTE day much of that interest is opened after the bell and gone by the close. Yesterday's put wall lost most of its positions at expiry, which is why today's 7660 reads soft; the first hour of fresh prints usually rebuilds or relocates the nearby walls, and the flip can move with them. A pre-market map is a starting point; the intraday refresh is the one that matters.
Levels are a map of dealer positioning, not a prediction. Not investment advice. How gamma walls & the HVL flip frame the SPX sessionEducational post: a simple way to frame an SPX session with dealer-gamma levels (the three horizontal lines on the chart are today's levels). Nothing here is a trade call.
1) Call wall — the strike above spot with the largest call gamma (7800 today). Dealers are long gamma there and sell into rallies, so it behaves as a ceiling / rally-fade zone and often marks the upper edge of the day's range.
2) Put wall / gamma support — the strike below spot with the largest put or positive gamma (the 0DTE gamma wall near 7675 today). It behaves as a cushion / bounce zone; a clean break below it means hedging flips from dampening to chasing the move, so the tape usually gets faster below it.
3) HVL (gamma flip, 7496 today) — the level where net dealer gamma turns from positive to negative. Above it, hedging dampens moves: range days, mean-reversion, GEX magnets work. Below it, hedging amplifies moves: trend days, wider ranges, stops need more room. First thing to check every morning: which side of the HVL price opens on.
4) 1-day cone — the expected move implied by front options (roughly spot x IV x sqrt(1/252), about +/-0.7% today), drawn as a band around spot. Walls inside the cone are the ones most likely to be tested; walls outside it are lower-probability targets.
How to draw them: pull today's strikes with the largest net gamma from an options-chain / GEX source, draw horizontal lines at the call wall (resistance), the put wall (support) and the HVL (flip), then add the +/-1-day expected move as two dotted lines. Redraw every morning after the open — gamma levels expire and migrate with open interest and 0DTE flow.
Reading the session: above the HVL and between the walls = range / fade-the-edges playbook. Below the HVL = momentum playbook, wider stops, next wall becomes an accelerator rather than support. Combine with price action and volume; these levels are a map of positioning, not a prediction. Not investment advice.  Education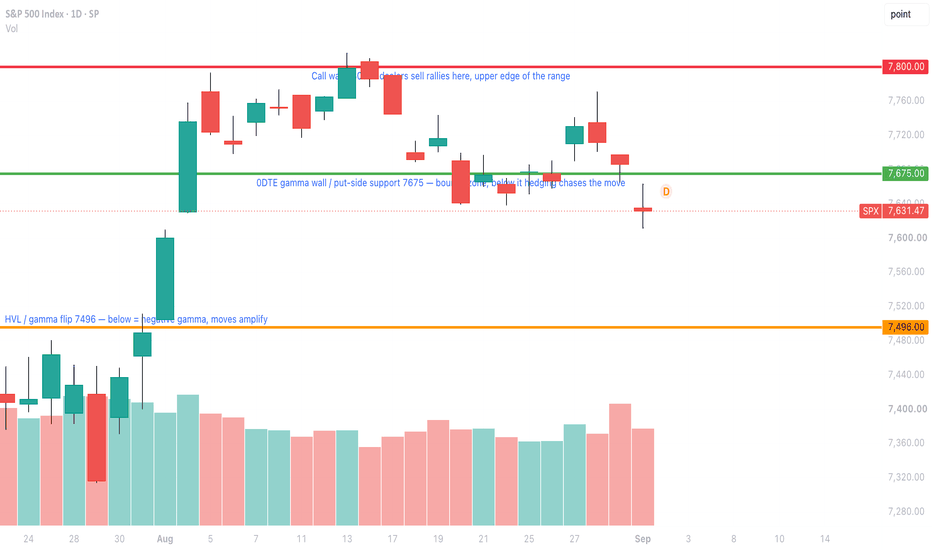
BIDU GEX - Positioning Before EarningsBIDU reports earnings tomorrow before the open, and the August 21 expiration (4 DTE) is the options window covering that print.
Price is trading near 102.5, just below HVL at 103, which keeps BIDU in a more reactive GEX regime. That places spot at the top of a wide put cluster — P2 at 101 and P3 at 100 — with the main call wall still overhead at 110.
What stands out is the split between pricing and flow. CALL$ is 84.1%, so calls are priced much richer than puts. Despite that, put volume below HVL is running well ahead of call volume on today's session. The strongest put flow on the August 21 expiration (4 DTE) is at 91, while the strongest call flow on that same expiry sits at 103 — right on HVL.
🔶 Earnings / Positioning 🔶
A heavy put cluster sitting just below HVL into an event often reflects speculative positioning around earnings — not just a static support level. That is the current 08/21 picture: puts are being worked underneath the regime pivot even as call pricing skew stays elevated.
The implied move is ±6.44% (±6.6), which maps roughly from the mid-90s toward the 109–110 call structure.
🔶 Regime Context 🔶
Below HVL at 103, BIDU shifts into a more reactive GEX regime, where price movements can become less stable. Spot is only about half a point below that pivot, so the first test is whether 103 is reclaimed — or whether the 100–101 put cluster has to absorb the move. Price also remains below the 50 SMA and 200 SMA, which sit overhead near the 108–110 call area.
🔶 Options Structure Context 🔶
👉 110 – C1 (highest call NETGEX wall)
Confluence at 110:
C1 — highest call NETGEX
nCV — strongest net call volume today
That makes 110 the main upside reaction zone on this expiry.
👉 109 – C3 + D+ — next call wall, strongest positive delta exposure
👉 115 – C2 — extension reference if 110 is cleared
If 110 is accepted, price would enter the positive gamma extension zone — gamma squeeze potential toward 115.
🔶 Downside Structure 🔶
👉 101 – P2 / 100 – P3 — put cluster just below spot and HVL
👉 91 – P1 + Ab1 + POI + AbOI + nPOI + nPV + PV
Confluence at 91:
P1 — strongest put wall
Ab1 — largest absolute gamma
POI — highest put open interest
AbOI — highest absolute open interest
nPOI — net put OI peak
nPV / PV — strongest put volume today
Together, this points to protective / speculative put positioning at 91 — the heaviest inventory and flow cluster on the 08/21 expiry.
If 91 is broken with acceptance, price would enter the negative gamma extension zone — downside gamma squeeze risk below that floor.
🔶 Options Sentiment 🔶
CALL$ 84.1% (60 DTE) means call options at an equivalent distance from spot are priced 84.1% higher than the corresponding puts — this is call pricing skew .
IVRank 49.9
IVx 50 (60 DTE)
CALL$ 84.1% (60 DTE) — call pricing skew
Implied move ±6.44% (±6.6)
🔶 Key Structure to Watch 🔶
103 — HVL / regime pivot (strongest call volume today)
100–101 — P3 / P2 put cluster
110 — C1 call wall
91 — P1 multi-confluence / strongest put flow (08/21, 4 DTE)
For now, the focus is how BIDU is positioned into tomorrow's BMO print: expensive calls, but put volume dominating below HVL on the 08/21 expiry.
The key question is whether the 100–101 put cluster and 103 HVL hold through the event — or whether the move stretches toward 110 on the upside or 91 on the downside. All-Time High: Finding Hidden Price Levels with Options Gamma1. What Happens When the Chart Runs Out of Resistance?
Price approaching an all-time high creates an unusual analytical problem.
Most traditional support and resistance techniques depend, at least partly, on historical price action. Previous highs, congestion areas, rejected levels and prior turning points give traders reference points around which to organize a market thesis.
But what happens when price moves into territory it has never visited before?
There may be no previous swing high above the market. No old resistance. No historical rejection. The chart effectively runs out of road.
That creates an especially interesting question for trade management: if a bullish breakout develops, where could the next meaningful reaction occur?
For this case study, the chart is based on E-mini S&P 500 futures (ES), with price around 7,809.25 when the options snapshot used in the analysis was captured. The relevant all-time-high reference on the futures chart is approximately 7,838.50.
Instead of trying to manufacture a resistance level where historical price structure does not exist, we can look somewhere else:
The options market.
Options continue to have strike prices above the underlying even when the futures market is trading near an all-time high. And those strikes contain information that may help us construct a map of potential future reaction areas.
The first piece of that puzzle is open interest.
2. Open Interest Gives Us a New Map
Open interest measures the number of outstanding option contracts.
If one strike contains substantially more open interest than surrounding strikes, it is reasonable to consider that strike noteworthy. There is simply more outstanding options positioning concentrated there.
This gives us something the futures chart cannot provide above an all-time high: additional price coordinates.
Suppose ES is trading near 7,800 and the options chain contains strikes at 7,900, 7,950, 8,000 and considerably higher levels. If unusually large open interest exists at one or more of those strikes, we suddenly have potential reference points in otherwise unexplored territory.
But there is a problem.
Open interest tells us how many contracts exist.
It does not tell us how sensitive those contracts currently are to a movement in ES.
A huge amount of open interest at a distant strike may look important while having relatively little immediate sensitivity to a small move in the underlying.
That is where gamma enters the picture.
3. Why Gamma Changes the Analysis
To understand why gamma matters, we first need delta.
Delta describes how much an option's value is expected to change for approximately a one-point change in its underlying, all else equal. From a hedging perspective, delta can also be interpreted as an approximation of the option's current directional exposure.
Gamma measures something different.
Gamma measures how quickly delta changes when the underlying moves.
In simplified form:
Change in Delta ≈ Gamma × Change in Underlying Price
Imagine an option with a delta of 0.30. As ES approaches the strike, its delta might eventually increase toward 0.50.
For someone dynamically hedging that option exposure, the important issue is not simply that the eventual delta is 0.50. Some portion of the hedge associated with the existing delta may already be established.
The interesting question is:
How much does the required hedge change as ES moves?
Gamma helps answer that question.
This distinction gives us a useful way to think about two different calculations:
Open Interest × Delta is closer to describing existing directional exposure or an approximation of current hedge requirements.
Open Interest × Gamma instead describes how sensitive those delta requirements may be to additional movements in the underlying.
That second question is particularly interesting when our objective is to identify price areas where future movement could potentially generate larger incremental hedging adjustments.
Other Greeks remain important, but they answer different questions.
Delta measures directional sensitivity and current hedge exposure.
Gamma measures how quickly delta changes with the underlying.
Vega measures sensitivity to changes in implied volatility.
Theta measures sensitivity to the passage of time.
Rho measures sensitivity to interest rates.
For the specific problem we are solving—identifying strikes where movements in ES may produce unusually large changes in option delta—gamma is particularly relevant.
4. Building a Gamma-Weighted Open Interest Map
The calculation is conceptually simple.
For calls:
Call Gamma Weight = Call Open Interest × Call Gamma
For puts:
Put Gamma Weight = Put Open Interest × Put Gamma
And for a combined strike-level measure:
Total Gamma Weight = Call OI × Call Gamma + Put OI × Put Gamma
For this case study, we’ve analyzed ES futures options associated with the September 2026 (U26) and December 2026 (Z26) structures and aggregated the gamma-weighted concentrations by strike.
The purpose is not to produce a magical support-and-resistance indicator.
Instead, the calculation asks a narrower and more defensible question:
At which strikes is there the greatest potential sensitivity of option delta to movements in the underlying, given the amount of outstanding open interest?
Or, in plain English:
Where could options-related hedging activity matter most?
That distinction will become important later.
5. Why the Largest Open Interest Isn't Necessarily the Most Important Level
This is where gamma weighting becomes especially useful.
Raw open interest can sometimes produce a misleading first impression.
In the December 2026 data used for this study, there was substantial call open interest around the 8,900 strike. Looking only at open interest might make 8,900 appear extremely important.
But ES was trading around 7,809.25.
The 8,900 strike was therefore far from the prevailing futures price, and its gamma was comparatively small.
Now compare that with 8,000.
Although raw open interest at 8,000 was not necessarily as visually spectacular as the distant concentration, 8,000 was much closer to the underlying market and carried considerably greater gamma sensitivity.
Once open interest was weighted by gamma, 8,000 became dramatically more relevant to the immediate market structure.
This demonstrates the key difference:
Open interest tells us where contracts exist.
Gamma-weighted open interest attempts to identify where those contracts may become particularly sensitive to movements in ES.
A large warehouse of options far away from price is not necessarily as relevant to the next market move as a smaller concentration whose delta is changing much more rapidly.
6. What the Gamma Map Reveals
Now we can apply the methodology to the actual ES dataset.
With ES around 7,809.25 at the time of the options snapshot, the largest combined gamma-weighted concentrations across the U26 and Z26 structures included:
7,700: 21.10
8,000: 18.93
7,800: 18.28
7,500: 16.54
7,550: 14.58
7,900: 13.33
7,600: 13.18
7,950: 11.73
7,400: 10.65
7,750: 9.16
The accompanying gamma map makes these relationships easier to visualize.
The central ladder represents strike prices. Red horizontal bars to the left represent put gamma-weighted open interest, while green bars to the right represent call gamma-weighted open interest. The dashed reference line around 7,809.25 marks the futures price when the source data was captured.
Immediately, a structure emerges.
Below price, the largest combined gamma concentration is 7,700.
Very close to price, 7,800 is also significant.
Above price, the concentrations progress through 7,900, 7,950 and finally 8,000.
And among the levels above the market, 8,000 stands out with a combined gamma weight of 18.93.
Instead of seeing empty space above an all-time high, we now have a potential sensitivity map.
7. Why 8,000 Becomes Particularly Interesting
This brings us back to the original problem.
Suppose ES establishes a sustained move above the approximately 7,838.50 all-time-high reference shown on the chart.
Where is the next resistance?
The historical chart cannot provide a conventional answer because there is little or no previous price structure above the high.
The options analysis gives us another framework.
Above the market we find:
7,900 → 7,950 → 8,000
These strikes form a notable upside gamma cluster, with 8,000 representing the largest gamma-weighted concentration above the analyzed futures price.
That does not mean ES must stop at 8,000.
It does not mean 8,000 is guaranteed resistance.
It does not even mean price must react negatively there.
It means something more precise:
Based on the analyzed options snapshot, 8,000 represents an unusually large concentration of potential option-delta sensitivity above the market.
That makes it a logical level to monitor for a potential market reaction and, importantly, a useful reference point for managing a hypothetical bullish position.
This is a very different claim from saying, “8,000 is resistance.”
The distinction matters.
8. When Options Structure Meets Price Structure
Options data is not the only information available on the chart.
At the time of this analysis, an existing UFO (UnFilled Orders) support zone was located approximately between 7,794.00 and 7,738.00.
This becomes interesting because the zone sits around another major options-derived reference: the 7,800 strike, which carries a combined gamma weight of approximately 18.28.
Two independent analytical methods therefore point toward roughly the same neighborhood.
The price-based methodology identifies an area of potential support between 7,794 and 7,738.
The options methodology independently identifies 7,800 as one of the strongest gamma-weighted concentrations in the dataset.
Confluence does not guarantee a reaction. But when two unrelated methodologies identify approximately the same region, that information can help a trader define a more structured hypothetical scenario.
This is where the analysis begins transitioning from market observation to risk management.
9. Turning the Map Into a Hypothetical Trade Plan
Consider two educational scenarios.
The first involves a retracement.
Instead of entering after price has already accelerated through its previous high, a trader could monitor a retracement toward the 7,794–7,738 UFO support area, which also sits near the significant 7,800 gamma concentration.
For illustration, assume an entry at 7,794.00, the upper boundary of the zone, with an invalidation point one minimum ES tick below the lower boundary at 7,737.75.
The risk would be:
7,794.00 − 7,737.75 = 56.25 points
Using 8,000 as the primary options-derived potential objective:
8,000 − 7,794 = 206 points
That produces an illustrative reward-to-risk ratio of approximately:
206 ÷ 56.25 = 3.66:1
A second scenario involves a breakout.
Suppose a trader waits for evidence that ES can establish itself above the 7,838.50 all-time-high reference. Using 7,838.75 purely as an illustrative entry—one minimum tick above that reference—and again placing the hypothetical invalidation point at 7,737.75, the risk becomes:
7,838.75 − 7,737.75 = 101 points
Potential distance to 8,000 becomes:
8,000 − 7,838.75 = 161.25 points
The resulting illustrative reward-to-risk ratio is approximately:
161.25 ÷ 101 = 1.60:1
These calculations highlight something important.
The target is not selected because 8,000 is a round number that “looks right.” It emerged independently from the gamma-weighted options analysis as the largest concentration above the analyzed market.
Meanwhile, the stop is not being selected from an arbitrary dollar-risk amount. It sits beyond the identified 7,794–7,738 price-support structure.
Intermediate gamma concentrations at 7,900 and 7,950 could also serve as potential reaction areas to monitor or hypothetical scale-out references before 8,000.
None of these levels guarantees a particular outcome. Their purpose is to create a logically connected framework linking entry, invalidation and potential objectives.
10. ES and MES: Same Levels, Very Different Dollar Exposure
The chart in this analysis uses E-mini S&P 500 futures (ES), but traders studying the same market structure can also reference Micro E-mini S&P 500 futures (MES).
The important difference is contract size.
For ES:
Ticker: ES
Contract multiplier: $50 × S&P 500 Index
Minimum outright price fluctuation: 0.25 index points
Dollar value of one tick: $12.50
Dollar value of one full index point: $50
For MES:
Ticker: MES
Contract multiplier: $5 × S&P 500 Index
Minimum outright price fluctuation: 0.25 index points
Dollar value of one tick: $1.25
Dollar value of one full index point: $5
MES is therefore one-tenth the size of ES.
Margin requirements are variable and should not be treated as permanent contract specifications. Currently:
ES Margin = ~$25,000 per contract
MES Margin = ~$2,500 per contract
11. Risk Management: Translate Chart Points Into Dollars
Consider again the hypothetical retracement scenario:
Entry: 7,794.00
Stop: 7,737.75
Risk: 56.25 points
For one ES contract:
56.25 × $50 = $2,812.50 of theoretical price risk
For one MES contract:
56.25 × $5 = $281.25 of theoretical price risk
Now consider the potential 8,000 objective.
From 7,794 to 8,000:
206 points
For ES, that represents a theoretical price difference of:
206 × $50 = $10,300 per contract
For MES:
206 × $5 = $1,030 per contract
The reward-to-risk relationship remains approximately 3.66:1 for either contract because changing contract size changes both sides proportionally.
Now consider the illustrative breakout scenario from 7,838.75 with the same 7,737.75 invalidation point.
Risk:
101 points
For ES:
101 × $50 = $5,050 per contract
For MES:
101 × $5 = $505 per contract
Potential distance to 8,000:
161.25 points
For ES:
161.25 × $50 = $8,062.50 per contract
For MES:
161.25 × $5 = $806.25 per contract
Reward-to-risk remains approximately 1.60:1.
These examples exclude commissions, fees, slippage, gaps and other execution effects and are included only to demonstrate the mechanics of translating a chart-based risk framework into contract-level dollar exposure.
This is also why MES can be useful in educational position-sizing examples. The smaller multiplier allows the same chart thesis to be expressed in smaller increments of dollar exposure.
The important lesson, however, is independent of contract choice:
Define invalidation first. Calculate the distance to that invalidation. Translate the distance into dollars. Only then determine appropriate position size.
12. The Biggest Limitation: We Don't Know the Dealers' Actual Positions
There is a major limitation to this methodology, and ignoring it would make the analysis far less credible.
Public open-interest data does not tell us who owns each side of every position.
We do not know:
whether dealers are net long or net short the relevant options;
how much delta has already been hedged;
whether hedges are being implemented through ES, SPX, SPY, another expiration, another strike or correlated instruments;
what offsetting options positions exist elsewhere;
the complete portfolio-level gamma exposure of market makers or other participants.
Therefore:
OI × Gamma is not a measurement of actual dealer positioning.
This article should not be interpreted as claiming that dealers “must buy” or “must sell” ES at any particular strike.
Without knowing the effective sign of dealer gamma, we cannot know whether associated hedging flows will dampen price movement, reinforce a move, contribute to pinning, generate rejection or potentially amplify a breakout.
The calculation instead identifies something we can observe more defensibly:
Where does the combination of outstanding open interest and gamma create relatively large potential sensitivity to changes in the underlying?
That is why we prefer terms such as:
gamma concentration
high-sensitivity level
potential reaction zone
potential support
potential resistance
These terms acknowledge uncertainty instead of pretending the options chain gives us certainty about future price behavior.
13. The Map Is Dynamic, Not Permanent
There is another reason these levels should never be treated as permanent support or resistance.
Gamma changes.
As ES moves toward or away from a strike, option gamma can change substantially.
Time also matters. As expiration approaches, gamma behavior can become very different, particularly around near-the-money strikes.
Implied volatility changes.
Open interest changes as positions are opened, closed, rolled or expire.
The relationship between the September and December structures can change as well.
Today's dominant gamma-weighted level may therefore not be next week's dominant level.
This means the gamma map should be treated as a timestamped market-structure snapshot, not a static technical indicator.
For this case study, the source options analysis corresponded to ES around 7,809.25 and combined information from the September 2026 and December 2026 structures.
If ES subsequently moves significantly, volatility changes or open interest migrates to different strikes, the analysis should be recalculated.
The methodology matters more than any individual number.
14. The Bigger Lesson: Price May Run Out of History, but Options Don't Run Out of Strikes
The most interesting part of this exercise is not whether ES eventually reacts at exactly 8,000.
The deeper lesson is how traders can approach a market for which traditional historical reference points are becoming scarce.
At an all-time high, the chart may have little to say about what lies above price.
The options market still has strikes.
Open interest tells us where outstanding contracts are concentrated.
Gamma tells us how sensitive option delta is to changes in the underlying.
Combining the two produces a map of where options-related sensitivity may be unusually large.
That leads to a useful conceptual progression:
Price chart → Options strikes → Open interest → Gamma → Gamma-weighted open interest → Potential reaction zones
In this particular snapshot, that process highlights 7,800 and 7,700 below the market, while the upside structure progresses through 7,900 and 7,950 toward the especially significant 8,000 concentration.
The existing 7,794–7,738 UFO support zone adds an independent price-based layer around the important 7,800 options level.
Together, those observations allow us to construct a hypothetical risk-management framework in which the market itself defines the relevant coordinates.
But gamma does not reveal the future.
It reveals sensitivity.
And when a chart is exploring territory it has never traded before, knowing where that sensitivity is concentrated may provide a valuable additional dimension to market-structure analysis.
Data Consideration
When charting futures, the data provided could be delayed. Traders working with the ticker symbols discussed in this idea may prefer to use CME Group real-time data plan on TradingView: www.tradingview.com - This consideration is particularly important for shorter-term traders, whereas it may be less critical for those focused on longer-term trading strategies.
General Disclaimer
The trade ideas presented herein are solely for illustrative purposes forming a part of a case study intended to demonstrate key principles in risk management within the context of the specific market scenarios discussed. These ideas are not to be interpreted as investment recommendations or financial advice. They do not endorse or promote any specific trading strategies, financial products, or services. The information provided is based on data believed to be reliable; however, its accuracy or completeness cannot be guaranteed. Trading in financial markets involves risks, including the potential loss of principal. Each individual should conduct their own research and consult with professional financial advisors before making any investment decisions. The author or publisher of this content bears no responsibility for any actions taken based on the information provided or for any resultant financial or other losses. Education 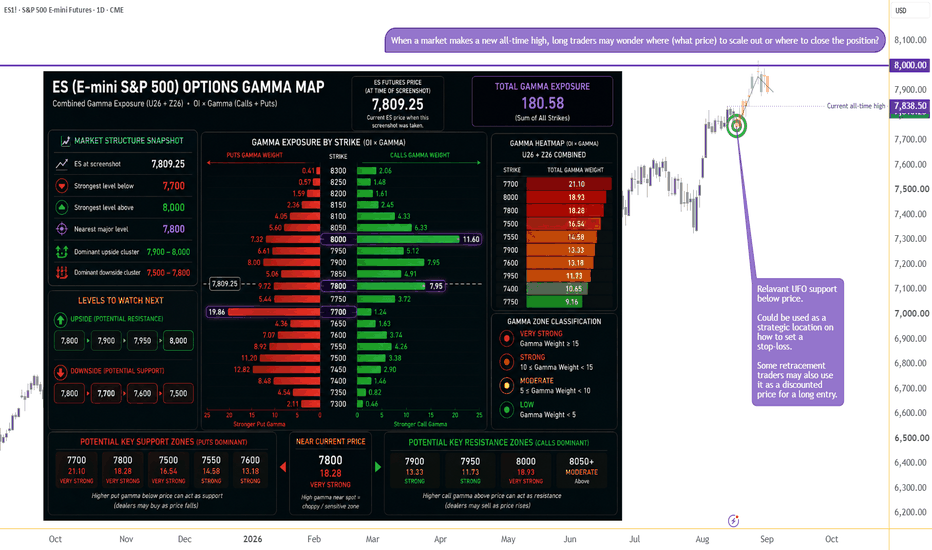
AVGO GEX - Negative GEX Below HVLAVGO has broken down from a multi-week sideways range on the daily chart and is now trading below HVL at 407.5 , inside a negative GEX regime .
If the decline does not slow, the next structural target is 380 – P1 . Overhead, 440 – C1 remains the highest call wall, well above this breakdown. Price has already lost the 400 Ab1 cluster.
🔶 Regime Context 🔶
Below HVL, AVGO sits in a more reactive GEX regime. A reclaim of 407.5 would be the first sign of repair — until then, the structure stays downside-oriented.
🔶 Downside Structure 🔶
👉 380 – P1 (strongest put wall)
Confluence at 380:
P1 — strongest put wall / largest negative NETGEX
nPV — strongest net put volume
If 380 fails, price enters the negative extension zone , with downside gamma squeeze potential toward 350 (P2) .
🔶 Options Sentiment 🔶
CALL$ 48.7% means call options at an equivalent distance from spot are priced 48.7% higher than the corresponding puts — this is call pricing skew . Even after the selloff, calls remain the more expensive side.
On the Options Oscillator, the green histogram remains elevated at the right edge — call skew is still persistent .
IVRank 35.2
IVx 51.7 | IVx 5dCh -1.7%
CALL$ 48.7% — call pricing skew
Implied move ±1.19% (±4.7)
🔶 Key Structure to Watch 🔶
407.5 (HVL) — regime pivot, now overhead
380 (P1) — next put wall / target
440 (C1) — highest call wall
The key question: does 380 slow the decline — or does acceptance below P1 open the extension toward 350 ? AAPL GEX - Call Wall Broken @ 310AAPL cleared a multi-week base under 310 and is now holding above that strike on the daily chart. For the 08/21 expiry (14 DTE, single), 310 is the C1 call wall — and it stacks with Ab1 and D+, so the breakout is through a real multi-metric reaction zone, not just a round number.
With C1 cleared, price has entered the positive extension zone — gamma squeeze potential opens toward the next call wall if acceptance holds above 310.
🔶 Regime Context 🔶
Spot is trading well above HVL at 300, keeping AAPL inside a positive GEX regime — price action typically becomes more controlled than below HVL. The 200 SMA remains far below (~280), so the medium-term trend backdrop stays constructive while the options structure is doing the near-term work.
🔶 Options Structure Context 🔶
👉 310 – C1 (highest call NETGEX wall) — breakout support
Confluence at 310 (08/21, 14 DTE, single):
C1 — highest call NETGEX
Ab1 — largest absolute gamma
D+ — strongest positive DEX peak
That makes 310 a clear reaction zone. Holding above it keeps the extension thesis alive; losing it puts the base break back into question.
👉 320 – C2 + CV + nCV — next magnet / target
Confluence at 320:
C2 — #2 call wall
CV — strongest call volume
nCV — strongest net call volume
Strongest call flow for 08/21 (14 DTE) is concentrated at 320 — same strike that also printed the largest call volume on the 0DTE (08/07) book. That dual signal turns 320 into the natural upside magnet inside the extension zone.
👉 330 – C3 — further extension reference if 320 accepts
🔶 Downside Structure 🔶
👉 300 – P1 / HVL / POI — regime pivot + put wall
Confluence at 300:
P1 — strongest put wall
HVL — gamma flip / regime pivot
POI — highest put open interest
Together, 300 is the main downside floor for this expiry. A clean break back through 310 would shift focus toward whether 300 can hold as the regime line.
👉 295 – P3 — next put wall below 300
Upper inventory note: for 08/21 , peak Call OI / AbOI sits further out at 340 — a distant call book magnet beyond C2/C3, not the breakout level itself.
🔶 Options Sentiment 🔶
CALL$ 23.7% means call options at an equivalent distance from spot are priced 23.7% higher than the corresponding puts — this is call pricing skew, and at this reading it remains moderate, not extreme.
On the Options Oscillator, the filled green histogram is not showing an aggressive blow-off in call skew — consistent with a controlled breakout rather than a panic chase.
IVRank 45.1
IVx 26.6 (14 DTE)
CALL$ 23.7% — call pricing skew
🔶 Key Structure to Watch 🔶
310 — C1 + Ab1 + D+ breakout support (must hold)
320 — C2 + strongest call volume (CV / nCV)
300 — P1 / HVL / POI downside floor
330 — C3 extension
For now, AAPL is holding inside a positive GEX regime above HVL, with the old 310 call wall flipped into support after the base break.
The key question is whether momentum can carry price toward the 320 call wall — and more importantly, how the market reacts once it gets there. SPX GEX - Call Wall Hit at 7750SPX has pushed into the 7750 call wall on the daily chart after a sharp, short-term stretch — price is trading well above the 50 SMA, with the advance looking overextended into the highest call NETGEX.
Spot sits near 7760.5, right at C1, while the largest absolute gamma ( Ab1 ) is parked just underneath at 7700 . That leaves the market pressing resistance with the heaviest absolute GEX still below price.
🔶 Regime Context 🔶
Price remains well above HVL near 7530 , so SPX is still inside a positive GEX regime — but the distance from HVL after this vertical run is large, and the immediate question is whether 7750 can absorb the move or force a mean-reversion dig.
🔶 Options Structure Context 🔶
👉 7750 – C1 — highest call NETGEX wall (now being tested)
👉 7700 – Ab1 — largest absolute gamma, sitting just below spot
That Ab1 pocket under the wall is the first structural magnet if momentum cools at C1.
🔶 Speculative Call Flow 🔶
Strongest call volume on the near-dated expiry ( 2026-08-07, 2 DTE ) sits at 7900 — well above spot. Upside interest remains alive beyond the wall, even as price is already pressing C1.
🔶 Downside Structure 🔶
👉 7530 – HVL — regime pivot
👉 7400 – P1 — put wall / strongest downside put NETGEX
These are separate levels: HVL is the regime flip higher up; P1 is the major put floor further below. A failed call-wall test opens room first toward HVL, then toward the 7400 put wall if selling expands.
🔶 Options Sentiment 🔶
PUT$ 22.3% flags an unusually low put pricing skew — puts at an equivalent distance from spot remain cheap relative to calls, which means downside hedges are underpriced and protective demand is muted into this stretch.
On the Options Oscillator, skew remains elevated near recent highs at the right edge — stretched call-side positioning alongside suppressed put pricing.
IVRank 34.7
IVx 16.2
PUT$ 22.3% — unusually low put pricing skew
Implied move ±0.59% (±45.6)
🔶 Key Structure to Watch 🔶
7750 — C1 call wall (active test)
7700 — Ab1 absolute gamma shelf
7900 — largest near-dated call volume
7530 — HVL (regime pivot)
7400 — P1 put wall
For now, SPX is overextended into the 7750 call wall with Ab1 at 7700 beneath spot and put hedges still cheap.
The key question is whether 7750 rejects and pulls price back toward 7700 / HVL at 7530 — or whether acceptance above C1 opens extension toward the 7900 call-volume magnet. DAX W30 - four references inside 50 pointsTHE FRAME
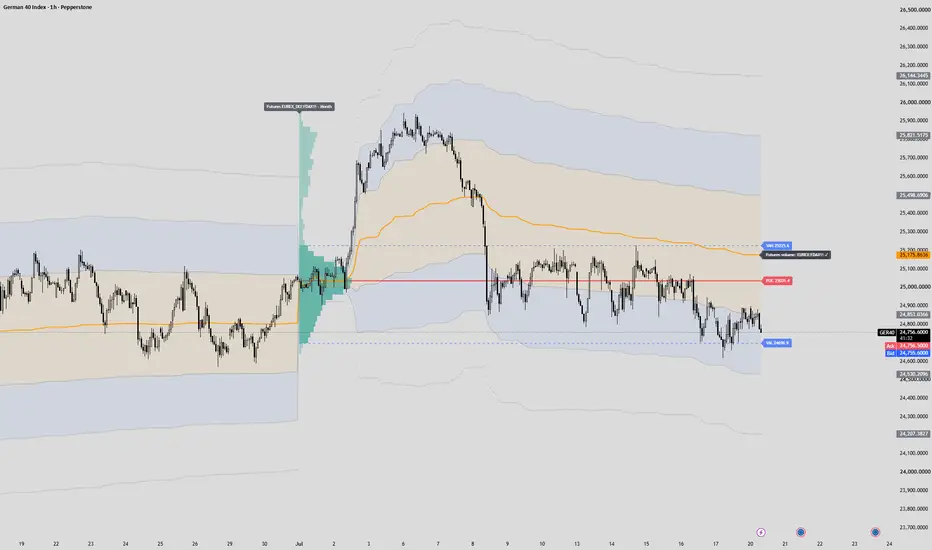
The week closed at 24,842.1. Below July's point of control, below the first standard deviation of the monthly VWAP, bottom third of the value area.
Volume for all of this comes from the FDAX contract, not from CFD tick counts, and gets mapped onto the price of the chart it is drawn on.
Value area high 25,225.6 Point of control 25,035.4 Value area low 24,698.9 Monthly VWAP 25,176.2 VWAP -1 sigma 24,853.4 Friday's close 24,842.1
WHERE THINGS STACK
Four references sit overhead inside 50.2 points:
25,126.0 gamma flip (7-45 DTE structure map) 25,150.5 Wednesday high 25,168.1 Monday high 25,176.2 monthly VWAP
An options-positioning model, two weekday highs and a volume-weighted average. None of the three knows the other two exist. This week they land on the same band anyway.
Downside has stations, not a void:
24,698.9 value area low 24,530.6 VWAP -2 sigma 24,500.0 put wall 24,207.8 VWAP -3 sigma
The put wall and the -2 sigma band are 30.6 points apart. Two methods, one shelf.
WHAT THE FRAME IMPLIES
Price sits under all of it, and the gamma model reads short gamma — moves get amplified instead of dampened. So the frame points down. The point of control at 25,035.4 is the first thing any bounce has to get through; going the other way, 24,698.9 comes first and 24,530.6 sits behind it.
One-day expected move is 242 points. That is the scale for a single session.
WHAT INVALIDATES IT
A daily close above 25,176.2. Above the whole band, not just into it. That puts price back inside value, flips the gamma reading, and everything above becomes history. It gets updated here when it happens.
And if neither 24,698.9 nor 25,176.2 is reached by Thursday, the reading was not wrong. It was useless. That verdict gets posted too.
THE LIMITS
The hit rate of a confluence like this has never been measured here, so nothing above is a probability statement.
In own backtesting the gamma flip sits above spot on roughly 85% of days, which means being below it carries almost no information by itself. It only counts here because three unrelated references agree with it.
And when these gamma levels were tested as magnets, the correlation came out at 0.21 or lower. Shelves, not walls.  Short
Short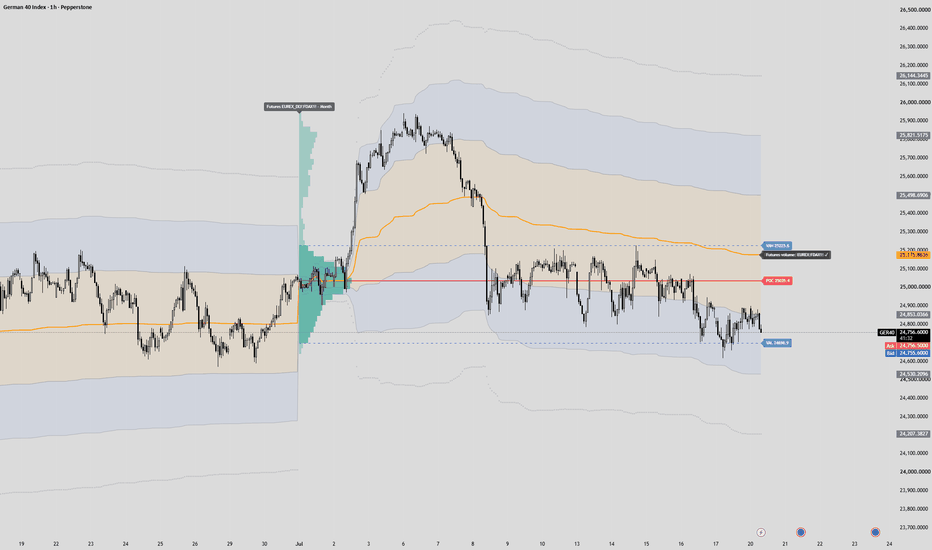
SPX – Double Bounce Off 50 SMA, 7600 Call Wall Confluence SPX is showing a constructive daily structure after two recent rebounds off the 50 SMA — first in June, then again in July. Each dip found buyers at that moving average before price pushed back higher.
Price is now trading around 7554, well above the 7495 HVL, which keeps SPX inside a positive GEX regime. In this environment, moves tend to be more controlled than below HVL, and upside can extend as long as the structure holds.
The next major reference is 7600 — the highest call NETGEX wall and the largest absolute gamma concentration on the profile.
🔶 Regime Context 🔶
With spot firmly above 7495 HVL, SPX remains in a positive GEX regime. The transition zone between 7400 P1 and 7600 C1 is where direction is being decided — but the gamma flip level has already been cleared, which favors controlled upside rather than reactive volatility.
🔶 Options Structure Context 🔶
👉 7600 – C1 (highest call NETGEX wall)
Confluence at 7600:
C1 — highest call NETGEX
Ab1 — largest absolute gamma
That makes 7600 a clear reaction zone — not just a round number. Price is now approaching this level after holding above HVL and bouncing twice from the 50 SMA.
🔶 Downside Structure 🔶
👉 7495 – HVL — regime pivot; must hold to keep positive GEX intact
👉 7400 – P1 — strongest put wall / primary downside support
A clean break below 7495 would shift the structure back toward a more reactive regime. 7400 remains the main put-side floor below.
🔶 Options Sentiment 🔶
PUT$ 57.3% (42 DTE) means put options at an equivalent distance from spot are priced 57.3% higher than the corresponding calls — this is put pricing skew. At this level, downside hedging demand is present but not extreme, which fits a mildly constructive rather than heavily defensive positioning tone.
Put pricing skew remains moderate rather than at defensive extremes — hedging urgency has not escalated into panic-style levels.
IVRank 31
IVx 15.6 (42 DTE)
PUT$ 57.3% (42 DTE) — put pricing skew
Implied move ±0.34% (±25.3)
🔶 Key Structure to Watch 🔶
7600 – C1 + Ab1 confluence — next major upside reaction zone
7495 – HVL — regime pivot; positive GEX depends on holding above
7400 – P1 — primary put wall / downside floor
50 SMA – dynamic support; two recent bounces confirm its role
For now, SPX is holding a positive GEX structure above HVL after two clean 50 SMA rebounds, with 7600 as the next major test.
The key question is whether momentum can reach the 7600 call wall confluence — and how price reacts once it gets there. ETH GEX - Price Rejection at 1790 Call Wall AgainETH is showing a structurally important pullback after failing at the highest call NETGEX wall for the second time.
On the daily chart, price recently formed a double bottom near the 1590 zone — where the strongest put wall (P1) and HVL align — and rallied back into the upper transition area. That bounce held the downside structure, but the upside test at 1790 has now been rejected again, with today's red candle marking the second failure at the C1 call wall.
This matters because 1590 is not just put wall — it is also the gamma flip / regime pivot. As long as price holds above it, ETH remains in a positive GEX regime. A sustained break below would shift conditions into a more reactive negative gamma environment.
🔶 Regime Context
Price is trading above HVL at 1590, keeping ETH inside a positive GEX regime for now. However, with spot sitting between P1 and C1, the market is still inside the transition zone — where direction can shift quickly depending on which major wall accepts or rejects price next.
🔶 Options Structure Context
👉 1790 – C1 (highest call NETGEX wall)
Price has now tested 1790 for the second time, and each approach has resulted in rejection from the largest call-side gamma concentration. Until 1790 is clearly accepted and held, the positive extension zone above C1 — and any gamma squeeze potential toward the next call wall — remains off the table.
🔶 Downside Structure
👉 1590 – P1 / HVL — strongest put wall + regime pivot
Confluence at 1590:
P1 — strongest put NETGEX
HVL — gamma flip / regime pivot
That makes 1590 the key reaction zone on any pullback — not just a round number, but the level where put support and the positive/negative GEX boundary meet.
👉 P2 — next put wall below if 1590 fails
🔶 Options Sentiment
CALL$ 12.1% means call options at an equivalent distance from spot are priced 12.1% higher than the corresponding puts — this is call pricing skew, though still relatively moderate rather than extreme.
On the Options Oscillator, the green histogram was elevated through the rally off the double bottom, but the right edge is fading after the second rejection at 1790 — call pricing skew appears to be declining from its recent peak.
IVRank 13.8
IVx 58.1
CALL$ 12.1% — call pricing skew
Implied move ±2.61%
🔶 Key Structure to Watch
1790 (C1) — upside ceiling until acceptance; second rejection now in play
1590 (P1 / HVL) — primary support + regime pivot; must hold on pullback
50 SMA — dynamic resistance overhead; price is currently trading below it after the C1 rejection
For now, ETH is caught between 1590 put/HVL support below and 1790 call resistance above after a double-bottom bounce that stalled at C1 again.
The key question is whether price can hold above 1590 on this pullback — or whether momentum re-tests the P1/HVL zone and forces a regime reassessment. /GC – Recovery Above HVL, 4315 Call Wall in FocusGold is showing early signs of stabilization on the daily chart after a sharp multi-month selloff. Price is now trading at 4175, holding above 4110 – HVL while the next major upside reference sits at 4315 – C1.
This matters because HVL acts as the regime pivot — above it, gold remains inside a positive GEX environment, where price action tends to become more controlled than in reactive downside conditions.
🔶 Regime Context 🔶
Gold is trading above HVL at 4110, keeping the market inside a positive GEX regime. The immediate question is not whether structure has turned fully bullish, but whether price can maintain acceptance above HVL and begin rotating toward the overhead call wall.
🔶 Options Structure Context 🔶
👉 4315 – C1 — highest call NETGEX wall / main upside reference
With spot at 4175, C1 sits roughly 140 points above current price — making it the clear upside magnet on the GEX profile if the recovery continues.
🔶 Downside Structure 🔶
👉 3935 – P1 — strongest put wall
Confluence at 3935:
P1 — highest negative NETGEX / strongest put wall
Ab1 — largest absolute gamma
nPOI — net put open interest peak
POI — highest put open interest
AbOI — highest absolute open interest
That makes 3935 a major multi-confluence reaction zone — not just a round number, but a deep put-side positioning cluster that anchors the downside structure well below current price.
👉 4110 – HVL — regime pivot directly below spot; loss of this level would shift gold back toward a more reactive gamma environment
🔶 Options Sentiment 🔶
IVRank at 33.5 sits in a moderate range — options are neither cheap nor at an extreme. IVx has edged lower over the past five days (IVx 5dCh -1.4%), consistent with slightly compressing premiums after the recent decline.
IVRank 33.5
IVx 25.6 | IVx 5dCh -1.4%
Implied move ±0.6% (±25)
🔶 Key Structure to Watch 🔶
4110 — HVL / regime pivot (must hold)
4315 — C1 / highest call wall above spot
3935 — P1 + Ab1 + nPOI + POI + AbOI / main downside floor
For now, gold is attempting a recovery above 4110 HVL, with 4315 C1 as the next major upside reference.
The key question is whether momentum can carry price toward the 4315 call wall — or whether the recovery stalls and rolls back toward HVL. HOOD – Breakout Above C2, 110 Call Wall in FocusHOOD is showing strong momentum on the daily chart, rallying sharply from the 70 area in April and now pressing into the 110 call wall after clearing 105 – C2 .
Price has flipped C2 from resistance into support and is trading inside the positive gamma extension corridor between 105 and 110 , with the next structural test at the highest call NETGEX concentration on the board.
🔶 Regime Context 🔶
Price is trading well above HVL at 82 , keeping HOOD inside a positive GEX regime — price action typically becomes more controlled than below HVL. The positive GEX dot on the Options Oscillator confirms the broader gamma backdrop remains supportive as momentum carries price toward C1.
🔶 Options Structure Context 🔶
👉 110 – C1 + CV (highest call NETGEX wall)
Confluence at 110:
C1 — highest call NETGEX
CV — strongest call volume flow today
That makes 110 a clear reaction zone — not just a round number, but the densest call-side NETGEX and volume cluster overhead.
👉 120 – C3 + nCV — next extension reference above C1 if 110 clears
If price accepts above 110 , HOOD enters deeper positive gamma extension — gamma squeeze potential opens toward 120 (C3 + nCV) if momentum holds.
👉 105 – C2 — cleared breakout support; must hold on any pullback
🔶 Downside Structure 🔶
👉 82 – HVL — regime pivot; loss of HVL would shift structure into a more reactive GEX environment
👉 75 – P2 — secondary put wall
👉 70 – P1 — strongest put NETGEX wall on the chart
👉 65 – P3 + nPV — lower put volume reference
🔶 Options Sentiment 🔶
CALL$ 72.8% (64 DTE) means call options at an equivalent distance from spot are priced 72.8% higher than the corresponding puts — this is call pricing skew , reflecting strong upside demand and elevated call premium relative to puts.
The Options Oscillator filled green histogram is elevated and rising at the right edge — call pricing skew is building at high levels , consistent with aggressive upside positioning as price approaches the 110 call wall.
IVRank 64.3
IVx 72.7 (64 DTE) | IVx 5dCh -2.1%
CALL$ 72.8% (64 DTE) — call pricing skew
Implied move ±2.17% (±2.3)
🔶 Key Structure to Watch 🔶
110 – C1 + CV multi-confluence call wall (immediate ceiling)
105 – C2 cleared support (must hold)
120 – C3 + nCV extension target if C1 breaks
82 – HVL regime pivot
For now, HOOD is pressing the 110 call wall after a powerful breakout above 105 , inside a positive GEX regime with elevated call pricing skew.
The key question is whether momentum can break and hold above 110 — triggering extension toward 120 — or whether C1 rejects and price retests 105 support.  Long
Long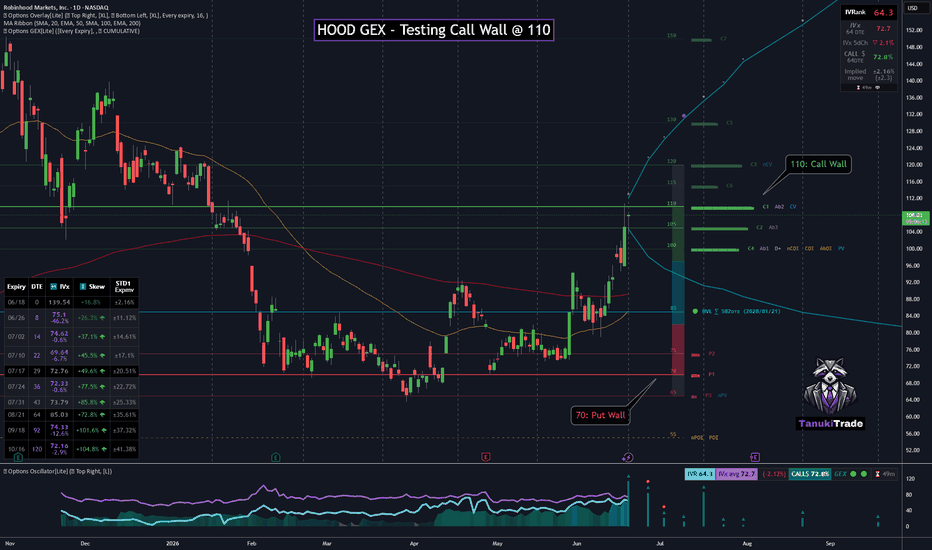
AAPL GEX - Testing 300 Call WallAAPL is consolidating on the daily chart after pulling back from the recent highs near 318 (nCOI zone), with price now sitting just below 300 — the highest call NETGEX wall on the board.
The stock remains structurally bullish on the daily timeframe, holding well above the 50 SMA and 200 SMA , but the immediate battle is whether momentum can reclaim and accept above the 300 multi-confluence cluster — or whether C1 continues to cap the bounce.
🔶 Regime Context 🔶
Price is trading well above HVL at 277.5 , keeping AAPL inside a positive GEX regime — price action typically becomes more controlled than below HVL. The broader gamma backdrop remains supportive, even as price compresses between nearby put support and the major call wall overhead.
🔶 Options Structure Context 🔶
👉 300 – C1 (highest call NETGEX wall)
Confluence at 300:
C1 — highest call NETGEX
Ab1 — largest absolute gamma
COI — highest call open interest
AbOI — largest absolute open interest
nCV / CV — strongest call volume flow
That makes 300 a clear reaction zone — not just a round number, but the densest call-side positioning cluster on the chart.
👉 310 – C2 — next call wall above if 300 clears
👉 318 – nCOI — overhead net call open interest reference from the recent peak zone
If price accepts above 300 , AAPL enters the positive gamma extension zone — gamma squeeze potential opens toward 310 (C2) and the 318 nCOI area if momentum holds.
🔶 Downside Structure 🔶
👉 292.5 – P3 — immediate put support below spot
👉 277.5 – HVL — regime pivot; loss of HVL would shift structure into a more reactive GEX environment
👉 250 – P2 + POI — secondary put cluster
👉 240 – P1 + nPOI — strongest put NETGEX wall on the chart
🔶 Options Sentiment 🔶
CALL$ 13.1% (66 DTE) means call options at an equivalent distance from spot are priced 13.1% higher than the corresponding puts — this is call pricing skew , reflecting modest upside demand rather than extreme call premium.
The Options Oscillator filled green histogram is rising from a recent low on the right edge — call pricing skew is building again after fading from prior peaks, consistent with renewed upside positioning interest as price approaches C1.
IVRank 32
IVx 24.3 (66 DTE) | IVx 5dCh -2.6%
CALL$ 13.1% (66 DTE) — call pricing skew
Implied move ±1.12% (±3.3)
🔶 Key Structure to Watch 🔶
300 – C1 multi-confluence call wall (immediate pivot)
292.5 – P3 immediate support
310 – C2 next upside target if C1 clears
277.5 – HVL regime pivot
For now, AAPL is pinned between P3 at 292.5 and the 300 call wall confluence , inside a positive GEX regime but below the heaviest call-side positioning.
The key question is whether momentum can break and hold above 300 — triggering extension toward 310 — or whether C1 rejects again and price retests 292.5 support.  Long
Long
MSFT GEX - Sitting right on Put WallMSFT is pressing into a familiar options level again.
On the daily chart, price is currently trading around 403 , sitting directly on top of 400 – P1 , the strongest put NETGEX wall. This is now the third time price has tested this zone in the current structure — and historically, 400 has acted as both support and resistance , not a one-direction level.
The immediate question is what happens right here , at the put wall.
🔶 Regime Context 🔶
Price is trading below HVL at 410 , keeping MSFT inside a negative GEX regime , where moves can become more reactive than above the gamma flip.
Technically, spot is also below the 50 SMA (~411) and well below the 200 SMA (~455) , so the broader daily structure remains heavy even while 400 is being defended again.
The first upside stabilization reference is not C1 yet — it is whether MSFT can reclaim and hold above 410 (HVL) . Until then, the structure stays in a more volatile, reactive environment.
🔶 Downside Structure 🔶
👉 400 – P1 — strongest put NETGEX wall / current battleground
This is the level to watch now. A hold here keeps the third test alive as a potential base. A clean break below 400 would shift MSFT into the negative gamma extension zone , opening downside gamma squeeze potential toward the next put references.
👉 380 – P2 — next put wall below
👉 385 – P3 — secondary downside reference
🔶 Options Structure Context 🔶
The upside map is much higher from here:
👉 460 – C1 — primary call NETGEX wall
👉 500 – C2 — major call-side cluster
Confluence at 500:
C2 — second-largest call NETGEX wall
COI — highest call open interest
CV — strongest call volume today
That makes 500 a significant upside positioning cluster — but it is far from current price. For now, the focus is not whether MSFT can reach 500, but whether 400 holds long enough for a rebound toward 410 (HVL) first.
🔶 Options Sentiment 🔶
CALL$ 21% means call options at an equivalent distance from spot are priced 21% higher than the corresponding puts — this is call pricing skew . The reading is present, but not extreme.
The Options Oscillator green histogram is modestly elevated at the right edge, with call pricing skew stable rather than accelerating into the P1 test.
IVRank 57.8
IVx 33.9 | IVx 5dCh +23.1%
CALL$ 21% — call pricing skew
Implied move ±1.82% (±7.34)
🔶 Key Structure to Watch 🔶
400 (P1) — third test / immediate decision level
410 (HVL) — regime pivot; reclaim needed for stabilization
500 (C2 + COI + CV) — major upside call cluster if momentum returns
For now, MSFT is not in a clean trend-reversal setup yet — it is in a put-wall decision zone below HVL.
The key question is whether 400 holds on this third test and allows a rebound toward 410 , or whether a break below P1 opens the negative extension path toward 390 (P2) .  Short
Short