NOC: the week the buyers showed upNOC: the week the buyers showed up
Look at the yellow line on this weekly chart of Northrop Grumman. It has been there since 2019.
Maybe you do not follow the company. Northrop Grumman builds hardware for the US military. Bombers, missiles, radars and satellites. The B-21 stealth bomber is theirs. So is Sentinel, the new land based nuclear missile. One main client, contracts that run for a decade, and almost nobody else able to do the work.
A trendline is not magic. It is a queue. It is the price where buyers have shown up again and again, year after year, and this queue is seven years old.
In July the price fell through it. It went down near 480. And in that same week it turned around and closed near the top of the candle.
That candle has a name. It is a hammer.
A long lower wick is not a shape. It is a crowd of buyers appearing in public, in one week, in front of everyone.
You may be thinking: nice story, one candle proves nothing.
I do not know what NOC does next. Nobody does. What I have is a clean place to be wrong. Price above the yellow line, stop just under the low of the hammer. If price closes back below that low, the queue is gone and so am I. I decide the exit before the entry, and that is the whole trade.
The company is not fighting the chart. In July, Northrop reported a record order book of 105 billion dollars, up 17% in a year. New orders were 1.84 times what it billed in the quarter. It raised its outlook for 2026.
Analysts moved during the summer. Citi went from 617 to 667. TD Cowen went from 550 to 590 and still rates it Hold. BTIG sits at 815. Bank of America kept its Buy in August. Those are their numbers, not mine. I do not trade targets.
What you take from this table
A trendline is a queue of buyers, and you can see where this one stands.
A hammer does not tell you where price is going. It tells you where the stop belongs.
Cheap risk beats a good story, every single time.
So is the hammer actually worth trading, or is it just a pretty shape everybody repeats? I counted them. Thousands of them, across the US market, against the only rival that matters: buying the index and sitting on the sofa.
The numbers go out soon.  Long
Long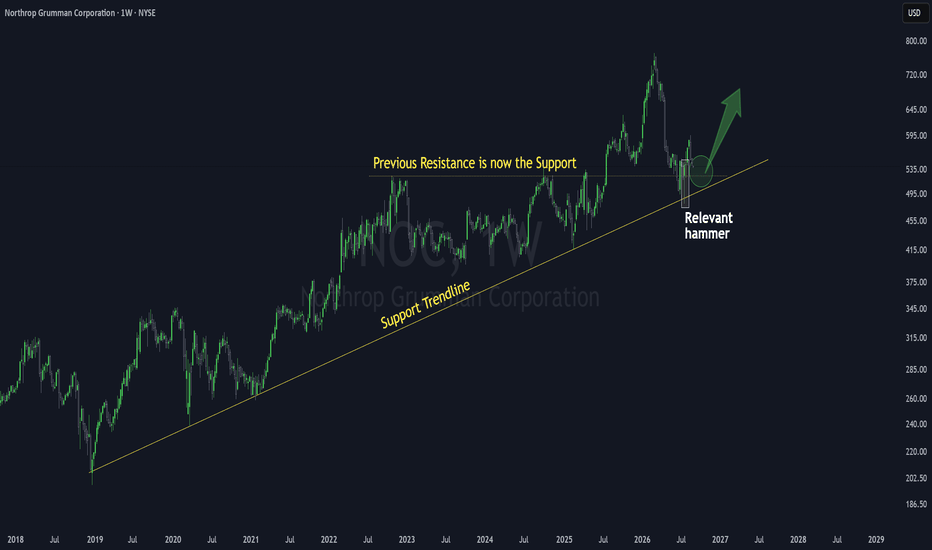
The man who invented candlesticks made a fortuneThe man who invented candlesticks made a fortune
Osaka, the middle of the 1700s.
A rice merchant from Sakata walks into the Dojima market, where traders buy and sell paper coupons for rice that has not been grown yet. As far as we know, that was one of the first organised futures markets in the world.
His name was Munehisa Homma. He got very rich in that room.
That part is documented.
The rest of the sentence in the title is where it gets interesting.
What he actually did
Homma did not build his fortune by predicting the weather or by reading news. He built it by predicting how people would behave .
In 1755 he wrote a book about how crowds behave in a market. One line in it still works today:
when everybody is bearish, there is reason for the price to rise.
That book is older than the United States, and it is probably one of the first books on market psychology ever written.
What nobody can prove
Every course, every video and every manual says that Homma invented the candlestick chart.
Steve Nison is the man who brought candles to the West. He had every reason to want the romantic version to be true. And in his own book he writes that he found hardly any evidence that Homma ever used these charts, and that candlesticks probably appeared in the early Meiji period, from 1868.
Homma died in 1803. That is 65 years earlier.
There is no single inventor. Candles were built slowly, by many hands, over generations. The famous five rules of Sakata were tied to Homma's name long after his death, by people who never met him.
I would love to tell you the romantic version, but there is no way to prove that Homma ever invented a single candlestick pattern. But that changes nothing.
Let me show you the other side
Now, you may be thinking: so the whole story is a lie and we all repeat it.
Not exactly.
Think of a candle as a thermometer. One candle is one reading of one session. The body tells you who won, buyers or sellers, and by how much. The wicks tell you how far each side pushed before they were sent back. It does not measure rice.
It measures people behaviour.
Homma spent his life measuring behaviour . That is the entire content of his book.
So did he draw candles? Nobody can prove it. Could he have used something very close to them? Perfectly possible, because they do the exact job he was already doing by eye.
A candle is not a forecast, it is a record of who won the session and by how much.
Two interesting things
The colours are backwards. On your screen green goes up. In the original Japanese charts red is the rising candle and black is the falling one. The old name for it was the yin yang chart, and red was the colour of life and growth. Open a Japanese broker screen and it will look broken to you. It is not. We are the ones who flipped it.
And the dates are much closer than you think. Candles reached Western traders through an English translation in 1986, a magazine article at the end of the 1980s, and Nison's book in 1991. Before that we drew bars. Candles have been normal here for about 35 years, not 300.
Since then we have all believed that candles work.
But do they?
So we counted every candlestick pattern, one by one
We took the S&P 500, 30 years of daily data, and counted what each candle actually did next. Entry at the open of the session after the signal, because that is the first price you could really pay.
The Hammer appeared 42,671 times. On average it returned +1.94% over the following 20 market sessions. The average S&P 500 stock over any 20 sessions returns 1.12%.
So the most famous bullish candle in the world beats the market. It works. It just does not work very much.
Now read that number again, because almost nobody publishes it.
The Inverted Hammer have similar returns, at +1.79% over 37,889 appearances. And the Hanging Man returned 1.22%, which is the market average with extra steps.
Here is the part worth keeping.
The Hanging Man is the same candle as the Hammer. Identical. Small body, long lower shadow. The same reading on the thermometer. The only difference is what the price did in the days before it. In those 30 years the market printed 42,671 Hammers and 58,161 Hanging Men, the same shape with two opposite names.
Same temperature, different patient. One of them holds up. The other one does not.
What you take from this table
Homma made his fortune reading behaviour, which is exactly what a candle measures, even if nobody can prove he ever drew one.
Red meaning "down" is a Western decision, not a Japanese one.
The famous patterns are real but thin on their own, and counting is the only way to find out which ones are worth your money.
Next we open the full list: 65 patterns, the same 30 years, ranked from best to worst. More than half of them do not pass. Some of the most famous names on your platform are in the bottom half, and one of them is probably on your chart today.
And I will publish a deep dive on the Hammer soon.
If you filter that same candle (Hammer) properly the average goes from +1.94% to +4.82% over the same 20 sessions, against 1.12% for the average stock. That is 4.3 times the market. The candle is the small edge. The filter is the big one. And if you have the proper exit strategy, the edge is simply massive .  Education
 Long
Long
 Long
Long
 Long
Long
 Long
Long
Long 
Mastering bullish candlestick patterns - How to use it!In this guide, we will explore some of the most important bullish candlestick patterns used in technical analysis. These patterns are essential tools for traders and investors who want to better understand market sentiment and identify potential reversal points where prices may start moving upward.
What will be explained:
- What are bullish candlestick patterns?
- What is the hammer?
- What is the inverted hammer?
- What is the dragonfly doji?
- What is the bullish engulfing?
- What is the morning star?
- What is the three white soldiers?
- How to use bullish candlestick patterns in trading?
What are bullish candlestick patterns?
Bullish candlestick patterns are specific formations on a candlestick chart that signal a potential reversal from a downtrend to an uptrend. These patterns are used by traders and investors to identify moments when the market sentiment may be shifting from bearish to bullish. Recognizing these patterns can help traders time their entries and make more informed decisions based on price action and market psychology. While no single pattern guarantees success, they can provide valuable clues when combined with other forms of analysis such as support and resistance, trendlines, and volume.
What is the Hammer?
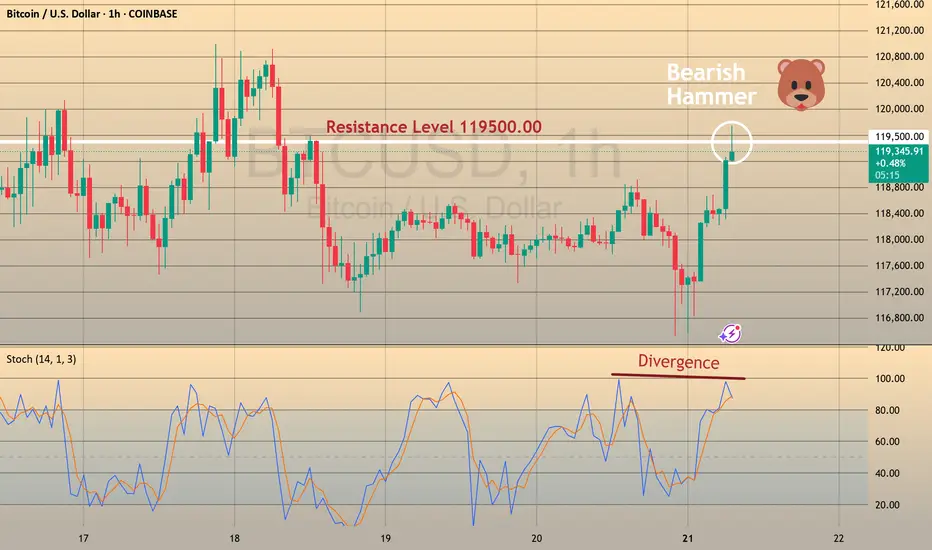
The Hammer is a single-candle bullish reversal pattern that typically appears at the bottom of a downtrend. It has a small real body located at the upper end of the trading range, with a long lower shadow and little to no upper shadow. The long lower wick indicates that sellers drove the price lower during the session, but buyers stepped in strongly and pushed the price back up near the opening level by the close. This shift in momentum suggests that the downtrend could be coming to an end, and a bullish move might follow.
What is the Inverted Hammer?
The Inverted Hammer is another single-candle bullish pattern that also appears after a downtrend. It has a small body near the lower end of the candle, a long upper shadow, and little to no lower shadow. This pattern shows that buyers attempted to push the price higher, but sellers managed to bring it back down before the close. Despite the failure to hold higher levels, the buying pressure indicates a possible reversal in momentum. Traders usually look for confirmation in the next candle, such as a strong bullish candle, before acting on the signal.
What is the Dragonfly Doji?
The Dragonfly Doji is a special type of candlestick that often indicates a potential bullish reversal when it appears at the bottom of a downtrend. It forms when the open, high, and close prices are all roughly the same, and there is a long lower shadow. This pattern shows that sellers dominated early in the session, pushing prices significantly lower, but buyers regained control and drove the price back up by the end of the session. The strong recovery within a single period suggests that the selling pressure may be exhausted and a bullish reversal could be imminent.
What is the Bullish Engulfing?
The Bullish Engulfing pattern consists of two candles and is a strong indication of a reversal. The first candle is bearish, and the second is a larger bullish candle that completely engulfs the body of the first one. This pattern appears after a downtrend and reflects a shift in control from sellers to buyers. The bullish candle’s large body shows strong buying interest that overpowers the previous session’s selling. A Bullish Engulfing pattern is even more significant if it occurs near a key support level, and it often signals the beginning of a potential upward move.
What is the Morning Star?
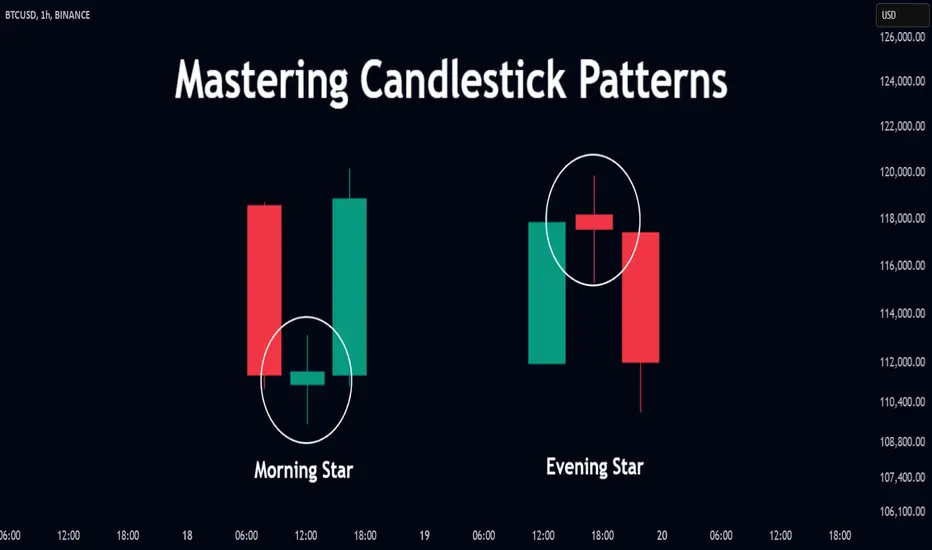
The Morning Star is a three-candle bullish reversal pattern that occurs after a downtrend. The first candle is a long bearish one, followed by a small-bodied candle (which can be bullish, bearish, or a doji), indicating indecision in the market. The third candle is a strong bullish candle that closes well into the body of the first candle. This formation shows a transition from selling pressure to buying interest. The Morning Star is a reliable signal of a shift in momentum, especially when confirmed by high volume or a breakout from a resistance level.
What is the Three White Soldiers?
The Three White Soldiers pattern is a powerful bullish reversal signal made up of three consecutive long-bodied bullish candles. Each candle opens within the previous candle’s real body and closes near or at its high, showing consistent buying pressure. This pattern often appears after a prolonged downtrend or a period of consolidation and reflects strong and sustained buying interest. The Three White Soldiers suggest that buyers are firmly in control, and the market may continue moving upward in the near term.
How to use bullish candlestick patterns in trading?
To effectively use bullish candlestick patterns in trading, it’s important not to rely on them in isolation. While these patterns can signal potential reversals, they work best when combined with other technical tools such as support and resistance levels, moving averages, trendlines, and volume analysis. Traders should also wait for confirmation after the pattern forms, such as a strong follow-through candle or a break above a resistance level, before entering a trade. Risk management is crucial—always use stop-loss orders to protect against false signals, and consider the broader market trend to increase the probability of success. By integrating candlestick analysis into a comprehensive trading strategy, traders can improve their timing and increase their chances of making profitable decisions.
Thanks for your support. If you enjoyed this analysis, make sure to follow me so you don't miss the next one. And if you found it helpful, feel free to drop a like 👍 and leave a comment 💬, I’d love to hear your thoughts! Education 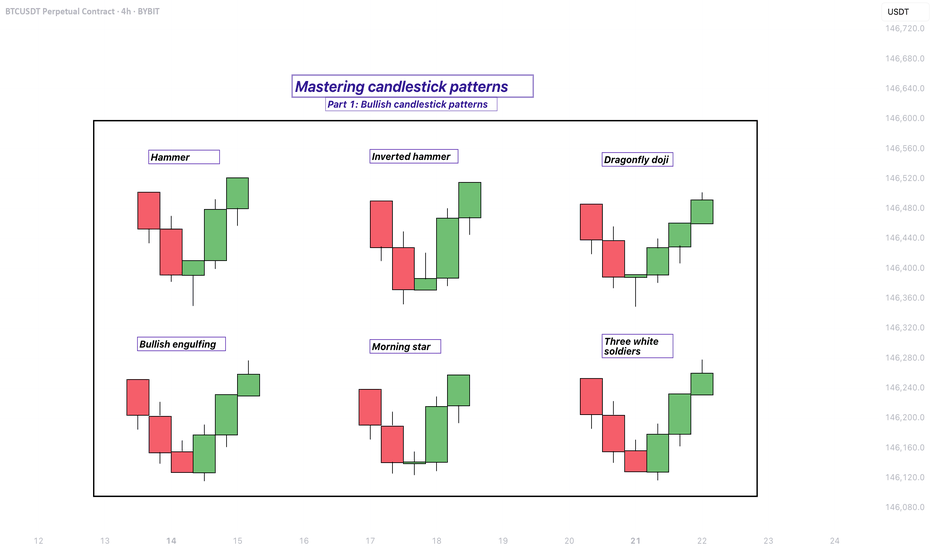
Short 
Mastering Candlestick Patterns - How to use them in trading!Introduction
Candlesticks are one of the most popular and widely used tools in technical analysis. They offer a visual representation of price movements within a specific time period, providing valuable insights into market trends, sentiment, and potential future price movements.
Understanding candlestick patterns is crucial for traders, as these formations can indicate whether a market is bullish or bearish, and can even signal potential reversals or continuations in price. While candlesticks can be powerful on their own, trading purely based on candlestick patterns can be challenging and risky.
-----------------------------------------------------------------------------------------------
What are we going to discuss:
1. What are candlesticks?
2. What are bullish candlestick patterns?
3. What are bearish candlestick patterns?
4. How to use candlestick patterns in trading?
-----------------------------------------------------------------------------------------------
1. What are candlesticks?
A candlestick in trading is a visual representation of price movement in a specific time period on a chart. It is a fundamental element used in technical analysis to study market trends, determine price levels, and predict potential future price movements. A single candlestick consists of four main components: the open, close, high, and low prices for that time period.
Here’s how a candlestick works:
- The Body: The rectangular area between the open and close prices. If the close is higher than the open, the body is green, indicating a bullish (upward) movement. If the close is lower than the open, the body is red, signaling a bearish (downward) movement.
- The Wick (high and low of the candle): The thin lines extending above and below the body. These represent the highest and lowest prices reached during the period. The upper wick shows the highest price, while the lower wick shows the lowest price.
- The Open Price: The price at which the asset began trading in that time period (for example, the start of a day, hour, or minute depending on the chart timeframe).
- The Close Price: The price at which the asset finished trading at the end of the period.
-----------------------------------------------------------------------------------------------
2. What are bullish candlestick patterns?
What is a Hammer Candlestick Pattern?
A hammer candlestick pattern has a small body near the top of the candle and a long lower wick, typically two to three times the length of the body. There is little to no upper wick. This formation shows that during the trading session, sellers managed to push the price significantly lower, continuing the downward momentum. However, buyers eventually stepped in with strong demand and drove the price back up near the opening level by the close.
What is an Inverted Hammer?
An inverted hammer has a small body near the bottom of the candle with a long upper wick, usually at least two to three times the size of the body, and little to no lower wick. This unique shape resembles an upside-down hammer, hence the name.
What is a Dragonfly Doji?
A dragonfly doji has a unique shape where the open, close, and high prices are all at or very close to the same level, forming a flat top with a long lower wick and little to no upper wick. This gives the candle the appearance of a "T," resembling a dragonfly.
What is a Bullish Engulfing?
A bullish engulfing candlestick consists of two candles. The first candle is bearish, indicating that sellers are still in control. The second candle is a large bullish candle that completely engulfs the body of the first one, meaning it opens below the previous close and closes above the previous open. This pattern reflects a clear shift in market sentiment. During the second candle, buyers step in with significant strength, overpowering the previous selling pressure and reversing the momentum. The fact that the bullish candle completely engulfs the previous bearish candle indicates that demand has taken over, signaling a potential trend reversal.
What is a Morning Star?
The morning star consists of three candles. The first is a long bearish candle, indicating that the downtrend is in full force, with strong selling pressure. The second candle is a small-bodied candle, which can be either bullish or bearish, representing indecision or a pause in the downtrend. Often, the second candle gaps down from the first, indicating that the selling pressure is subsiding but not yet fully reversed. The third candle is a long bullish candle that closes well above the midpoint of the first candle, confirming that buyers have taken control and signaling the potential start of an uptrend.
-----------------------------------------------------------------------------------------------
3. What are bearish candlestick patterns?
What is a Shooting Star?
A shooting star has a smal body near the low of the candle and a long upper wick, usually at least twice the size of the body, with little to no lower wick. This shape shows that buyers initially pushed the price higher during the session, continuing the upward momentum. However, by the close, sellers stepped in and drove the price back down near the opening level.
What is a Hanging Man?
A hanging man has a distinct shape, with a small body positioned near the top of the candle and a long lower wick, usually at least twice the length of the body. There is little to no upper wick. The appearance of this candle suggests that although there was strong selling pressure during the session, buyers managed to bring the price back up near the opening level by the close. Despite the recovery, the long lower wick shows that sellers were able to push the price down significantly at one point. This introduces uncertainty into the uptrend and can indicate that bullish momentum is weakening.
What is a Gravestone Doji?
A gravestone doji has a distinctive shape where the open, low, and close prices are all at or near the same level, forming a flat base. The upper wick is long and stretches upward. This shape resembles a gravestone, which is where the pattern gets its name.
What is a Bearish Engulfing?
A bearish engulfing candlestick pattern is a two-candle reversal pattern that typically appears at the end of an uptrend and signals a potential shift from bullish to bearish sentiment. The first candle is a smaller bullish candle, reflecting continued upward momentum. The second candle is a larger bearish candle that completely engulfs the body of the first one, meaning it opens higher than the previous close and closes lower than the previous open. This indicates that bears have taken control, overpowering the buyers, and suggests a potential downside movement.
What is an Evening Star?
An evening star is a bearish candlestick pattern that typically signals a potential reversal at the top of an uptrend. It consists of three candles and reflects a shift in momentum from buyers to sellers. The pattern starts with a strong bullish candle, showing continued buying pressure and confidence in the upward move. This is followed by a smaller-bodied candle, which can be bullish or bearish, and represents indecision or a slowdown in the uptrend. The middle candle often gaps up from the first candle, showing that buyers are still trying to push higher, but the momentum is starting to weaken. The third candle is a strong bearish candle that closes well into the body of the first bullish candle. This candle confirms that sellers have taken control and that a trend reversal could be underway. The more this third candle erases the gains of the first, the stronger the reversal signal becomes.
-----------------------------------------------------------------------------------------------
4. How to use candlestick patterns in trading?
Candlestick patterns are most useful when they appear at key levels, such as support, resistance, or significant trendlines. For instance, if a bullish reversal pattern like a hammer or bullish engulfing forms at a support level, it may indicate that the downtrend is losing momentum, and a reversal could be coming.
Trading based on candlestick patterns alone can be risky. To improve your chances of success, always seek additional confirmation from other technical analysis tools. Here are some common ones:
- Support and Resistance Levels: Look for candlestick patterns that form near key support or resistance levels. For instance, if the price reaches a support zone and a bullish reversal candlestick pattern forms, this may suggest a potential upward reversal.
- Fibonacci Retracement: Use Fibonacci levels to identify potential reversal zones. If a candlestick pattern appears near a key Fibonacci level (such as the Golden Pocket), it adds confirmation to the idea that the price may reverse.
- Liquidity Zones: These are areas where there is a high concentration of buy or sell orders. Candlestick patterns forming in high liquidity zones can indicate a stronger potential for a reversal or continuation.
- Indicators and Oscillators: Incorporating indicators like the Relative Strength Index (RSI), Moving Averages, MACD, or Stochastic RSI can help confirm the momentum of the price. For example, if a candlestick pattern forms and the RSI shows an oversold condition (below 30), this could indicate a potential reversal to the upside.
It’s crucial to wait for confirmation before entering a trade. After a candlestick pattern forms, it’s important to wait for the next candle or price action to confirm the signal. For example, if you spot a bullish reversal candlestick like a hammer at support, wait for the next candle to close above the hammer’s high to confirm that buyers are in control and a reversal is likely.
-----------------------------------------------------------------------------------------------
Thanks for your support.
- Make sure to follow me so you don't miss out on the next analysis!
- Drop a like and leave a comment!
Education 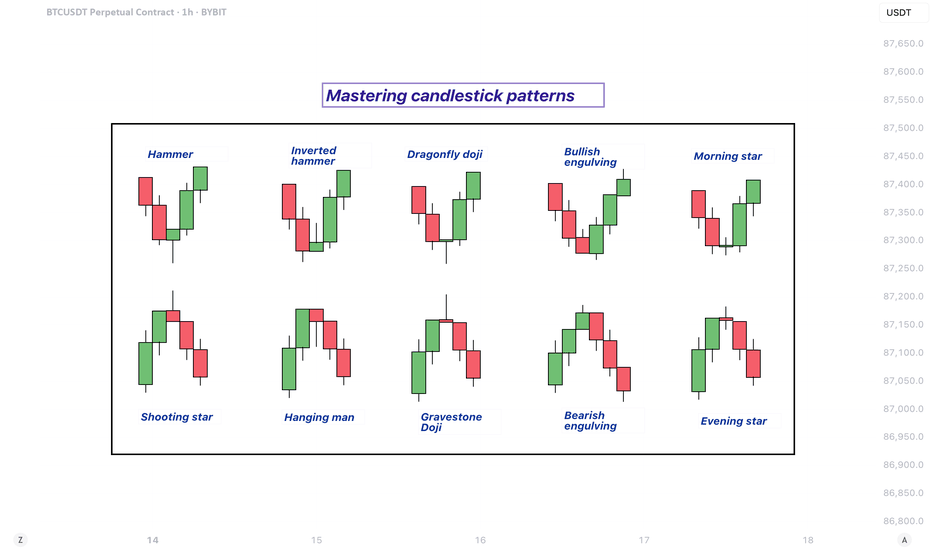
 Long
Long
Mastering Candlestick Patterns: Visual Guide for Traders
🔵 Introduction
Candlestick charts are among the most popular tools used by traders to analyze price movements. Each candlestick represents price action over a specific time period and provides valuable insights into market sentiment. By recognizing and understanding candlestick patterns, traders can anticipate potential price reversals or continuations, improving their trading decisions. This article explains the most common candlestick patterns with visual examples and practical Pine Script code for detection.
🔵 Anatomy of a Candlestick
Before diving into patterns, it's essential to understand the components of a candlestick:
Body: The area between the open and close prices.
Upper Wick (Shadow): The line above the body showing the highest price.
Lower Wick (Shadow): The line below the body showing the lowest price.
Color: Indicates whether the price closed higher (bullish) or lower (bearish) than it opened.
An illustrative image showing the anatomy of a candlestick.
🔵 Types of Candlestick Patterns
1. Reversal Patterns
Hammer and Hanging Man: These single-candle patterns signal potential reversals. A Hammer appears at the bottom of a downtrend, while a Hanging Man appears at the top of an uptrend.
Engulfing Patterns:
- Bullish Engulfing: A small bearish candle followed by a larger bullish candle engulfing the previous one.
- Bearish Engulfing: A small bullish candle followed by a larger bearish candle engulfing it.
Morning Star and Evening Star: These are three-candle reversal patterns that signal a shift in market direction.
Morning Star: Occurs at the bottom of a downtrend, indicating a potential bullish reversal. It consists of:
- A long bearish (red) candlestick showing strong selling pressure.
- A small-bodied candlestick (bullish or bearish) indicating indecision or a pause in selling. This candle often gaps down from the previous close.
- A long bullish (green) candlestick that closes well into the body of the first candle, confirming the reversal.
Evening Star: Appears at the top of an uptrend, signaling a potential bearish reversal. It consists of:
- A long bullish (green) candlestick showing strong buying pressure.
- A small-bodied candlestick (bullish or bearish) indicating indecision, often gapping up from the previous candle.
- A long bearish (red) candlestick that closes well into the body of the first candle, confirming the reversal.
2. Continuation Patterns
Doji Patterns: Candles with very small bodies, indicating market indecision. Variations include Long-Legged Doji, Dragonfly Doji, and Gravestone Doji.
Rising and Falling Three Methods: These are five-candle continuation patterns indicating the resumption of the prevailing trend after a brief consolidation.
Rising Three Methods: Occurs during an uptrend, signaling a continuation of bullish momentum. It consists of:
- A long bullish (green) candlestick showing strong buying pressure.
- Three (or more) small-bodied bearish (red) candlesticks that stay within the range of the first bullish candle, indicating a temporary pullback without breaking the overall uptrend.
- A final long bullish (green) candlestick that closes above the high of the first candle, confirming the continuation of the uptrend.
Falling Three Methods: Appears during a downtrend, indicating a continuation of bearish momentum. It consists of:
- A long bearish (red) candlestick showing strong selling pressure.
- Three (or more) small-bodied bullish (green) candlesticks contained within the range of the first bearish candle, reflecting a weak upward retracement.
- A final long bearish (red) candlestick that closes below the low of the first candle, confirming the continuation of the downtrend.
🔵 Coding Candlestick Pattern Detection in Pine Script
Detecting patterns programmatically can improve trading strategies. Below are Pine Script examples for detecting common patterns.
Hammer Detection Code
//@version=6
indicator("Hammer Pattern Detector", overlay=true)
body = abs(close - open)
upper_wick = high - math.max(close, open)
lower_wick = math.min(close, open) - low
is_hammer = lower_wick > 2 * body and upper_wick < body
plotshape(is_hammer, title="Hammer", style=shape.triangleup, location=location.belowbar, color=color.green, size=size.small)
Bullish Engulfing Detection Code
//@version=6
indicator("Bullish Engulfing Detector", overlay=true)
bullish_engulfing = close < open and close > open and close > open and open < close
plotshape(bullish_engulfing, title="Bullish Engulfing", style=shape.arrowup, location=location.belowbar, color=color.blue, size=size.small)
🔵 Practical Applications
Trend Reversal Identification: Use reversal patterns to anticipate changes in market direction.
Confirmation Signals: Combine candlestick patterns with indicators like RSI or Moving Averages for stronger signals.
Risk Management: Employ patterns to set stop-loss and take-profit levels.
🔵 Conclusion
Candlestick patterns are powerful tools that provide insights into market sentiment and potential price movements. By combining visual recognition with automated detection using Pine Script, traders can enhance their decision-making process. Practice spotting these patterns in real-time charts and backtest their effectiveness to build confidence in your trading strategy. Education 
 Long
Long
 Long
Long
 Long
Long
 Long
Long
 Long
Long
SWING IDEA - EQUITAS SMALL FINANCE BANKEquitas Small Finance Bank , a leading small finance bank in India, is showing promising signs for a potential swing trade.
Reasons are listed below :
75 Zone as a Strong Support Zone : The 75 level has proven to be a solid support zone, providing a strong foundation for a potential upward move.
Bullish Hammer on Weekly Timeframe : The formation of a bullish hammer on the weekly chart, which also engulfed the previous week's candle, indicates strong buying pressure and a potential reversal from the support level.
0.5 Fibonacci Support : The stock is currently resting at the 0.5 Fibonacci retracement level, a key area where buyers often step in to push the price higher.
Gradual Uptick in Volumes : An increasing volume trend suggests growing investor interest, further supporting the potential for a bullish move.
Target - 95 // 105 // 115
Stoploss - weekly close below 72
DISCLAIMER -
Decisions to buy, sell, hold or trade in securities, commodities and other investments involve risk and are best made based on the advice of qualified financial professionals. Any trading in securities or other investments involves a risk of substantial losses. The practice of "Day Trading" involves particularly high risks and can cause you to lose substantial sums of money. Before undertaking any trading program, you should consult a qualified financial professional. Please consider carefully whether such trading is suitable for you in light of your financial condition and ability to bear financial risks. Under no circumstances shall we be liable for any loss or damage you or anyone else incurs as a result of any trading or investment activity that you or anyone else engages in based on any information or material you receive through TradingView or our services.
@visionary.growth.insights  Long
Long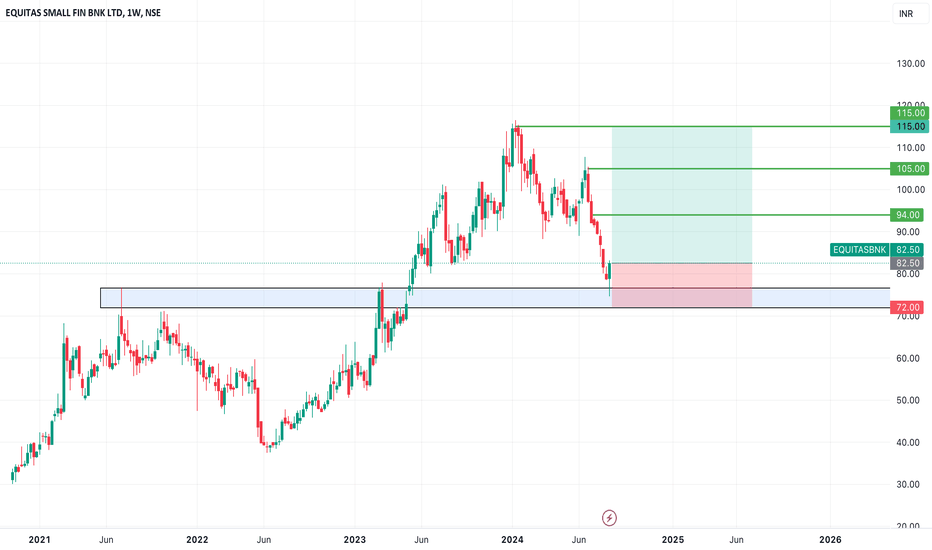
 Long
Long
The Art of Candlestick Trading: How to Spot Market Turns EarlyBuckle up, TradingViewers! It's time to unravel the ancient secrets of candlestick patterns. Originating from an 18th-century Japanese rice trader, these patterns aren't simply red and green elements on your trading charts—they are the Rosetta Stone of market sentiment, offering insights into the highs and lows and the middle ground of buyers and sellers’ dealmaking.
If you’re ready to crack the code of the market from a technical standpoint and go inside the minds of bulls and bears, let’s light this candle!
Understanding the Basics: The Candlestick Construction
First things first, let’s get the basics hammered out. A candlestick (or Candle in your TradingView Supercharts panel) displays four key pieces of information: the open, close, high, and low prices for a particular trading period. It might be 1 minute, 4 hours, a day or a week — candlesticks are available on every time frame. Here’s the breakdown:
The Body : This is the chunky part of the candle. If the close is above the open, the body is usually colored in white or green, representing a bullish session. If the close is below the open, the color is usually black or red, indicating a bearish session.
The Wicks (or Shadows) : These are the thin lines poking out of the body, showing the high and low prices during the session. They tell tales of price extremes and rejections.
Understanding the interplay between the body and the wicks will give you insight into market dynamics. It’s like watching a mini-drama play out over the trading day.
Key Candlestick Patterns and What They Mean
Now onto the fun part — candlestick formations and patterns may help you spot market turns (or continuations) early in the cycle.
The Doji : This little guy is like the market’s way of throwing up its hands and declaring a truce between buyers and sellers. The open and close are virtually the same, painting a cross or plus sign shape. It signals indecision, which could mean a reversal or a continuation, depending on the context. See a Doji after a long uptrend? Might be time to brace for a downturn.
The Hammer and the Hanging Man : These candles have small bodies, little to no upper wick, and long lower wicks. A Hammer usually forms during a downtrend, suggesting a potential reversal to the upside. The Hanging Man, its evil twin, appears during an uptrend and warns of a potential drop.
Bullish and Bearish Engulfing: These are the bullies of candlestick patterns. A Bullish Engulfing pattern happens when a small bearish candle is followed by a large bullish candle that completely engulfs the prior candle's body — suggesting a strong turn to the bulls. Bearish Engulfing is the opposite, with a small bullish candle followed by a big bearish one, hinting that bears might be taking control of the wheel.
The Morning Star and the Evening Star : These are three-candle patterns signaling major shifts. The Morning Star — a bullish reversal pattern — consists of a bearish candle, a small-bodied middle candle, and a long bullish candle. Think the dawn of new bullish momentum. The Evening Star, the bearish counterpart, indicates the onset of bearish momentum, as if the sun is setting on bullish prices.
The Shooting Star and the Inverted Hammer : Last but not least, these candles indicate rejection of higher prices (Shooting Star) or lower prices (Inverted Hammer). Both feature small bodies, long upper wicks, and little to no lower wick. They flag price exhaustion and potential reversals.
Trading Candlestick Patterns: Tips for Profitable Entries
Context is King : Always interpret candlestick patterns within the larger market context. A Bullish Engulfing pattern at a key support level is more likely to pan out than one in no-man’s-land.
Volume Validates : A candlestick pattern with high trading volume gives a stronger signal. It’s like the market shouting, “Hey, I really mean this move!”
Confirm with Other Indicators : Don’t rely solely on candlesticks, though. Use them in conjunction with other technical tools like RSI, MACD, or moving averages to confirm signals.
Wrapping It Up
Candlestick patterns give you a sense for the market’s pulse and offer insights into its moment-to-moment sentiment — is it overreacting or staying too tight-lipped. Mastering candlesticks can elevate your trading by helping you spot trend reversals and continuations. These patterns aren’t foolproof — they are powerful tools in your trading toolkit but require additional work, knowledge and context to give them a higher probability of confirmation.
It’s time to light up those charts and let the candlesticks illuminate your trading path to some good profits!
 Long
Long
 Short
Short