Bitcoin(BTC/USD) Daily Chart Analysis For Week of May 8, 2026Technical Analysis and Outlook:
The prices of cryptocurrencies have rebounded strongly in this week's trading session, completing the next Inner Coin Rally at 82,700 and retracing to the Mean Support level of 79,500.
Currently, the cryptocurrency is positioned to decline to the Mean Support level of 78,100, with the possibility of extending to the Mean Support at 75,800.
There is also the potential for sustained upward momentum to retest the Mean Resistance level of 81,500, followed by a retest of the completed Inner Coin Rally at 82,700. ORCL: Oracle – Bull Run in Full Swing!The Investment Thesis (Updated):
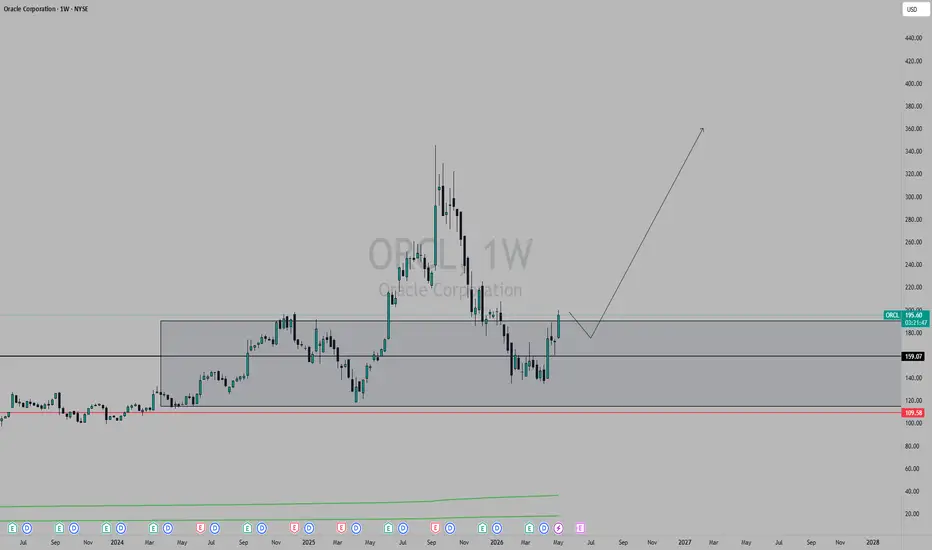
Oracle (ORCL) is officially playing out exactly as we anticipated. The company's transformation from a legacy database provider into the vital "nervous system" of global AI infrastructure is driving massive momentum. Even though the price has already surged, the colossal backlog for Oracle Cloud Infrastructure (OCI) orders proves that the fundamental tailwinds are just getting started.
Given our high long-term targets, the train has not left the station. In the current environment, any short-term pullback is a textbook opportunity to accumulate or add to the position before the next leg up towards new All-Time Highs (ATH).
1. Fundamentals: Strong Margins & Exponential Demand
Still Undervalued on a Macro Scale: Even with the recent run-up, conservative DCF (Discounted Cash Flow) valuations still place Oracle’s fair value in the $255 region. The long-term margin of safety remains highly attractive.
EPS Acceleration: A projected year-over-year earnings growth of 23.88% keeps Oracle at the absolute forefront of the Software sector, easily outperforming its peers.
Economic Moat: High-margin subscriptions and strategic partnerships with OpenAI and hyperscalers ensure highly predictable, recurring revenues with strong net margins (~25%).
2. Technical Analysis (Weekly Chart - W1):
Chasing New All-Time Highs
The Breakout is Real: After a solid reaccumulation phase, the price has successfully broken out of its previous consolidation channel. The old resistance levels are now turning into key support zones.
Our Bullish Stance: Since we are already trading much higher, we are no longer chasing green candles. Instead, every minor pullback or local correction is now our ideal entry trigger to aggressively add to our positions.
Targets: The intermediate structural target is $220, with our ultimate macro target set at a new All-Time High ($255+).
3. Key Risks to Monitor
Debt Servicing: A Debt-to-Equity ratio of 344% requires ongoing attention, especially if macroeconomic conditions or central bank policies shift.
Healthy Consolidation: Temporary sideways movement or minor profit-taking should be expected after such a strong rally—but again, we view these dips as buying opportunities, not reasons to panic.
The Game Plan (Updated):
The Strategy: Accumulate on dips. Do not chase the highs, but use any red days or local retracements to build/expand your position.
Accumulation Zone: Look for entries during pullbacks to newly established support levels.
Ultimate Target: Ride the wave to new All-Time Highs ($255+).
We are well on our way, but the journey isn't over. How are you playing Oracle here? Are you adding to your position on any minor dips, or are you waiting for a deeper correction? Let's discuss in the comments! 👇  Long
Long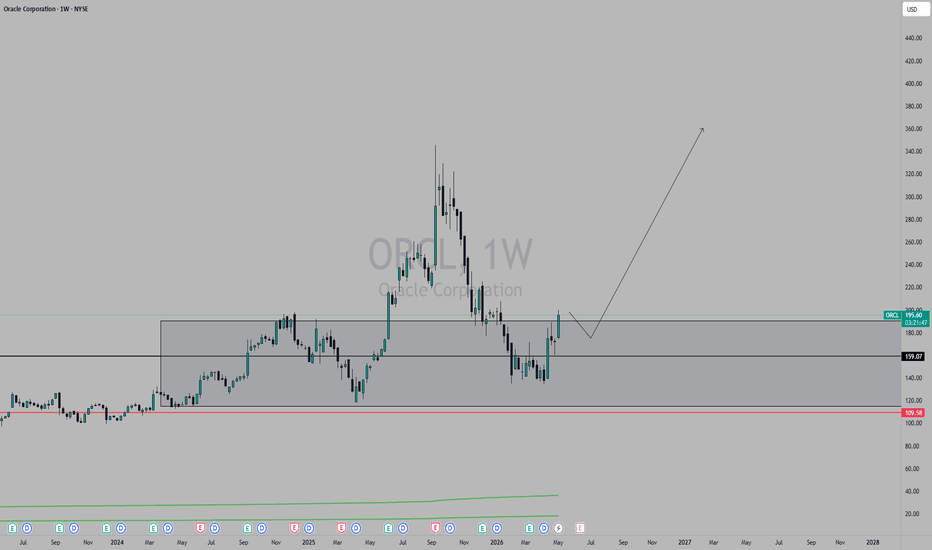
UBER: Quiet Accumulation Before a Rally Back to $100?The Investment Thesis:
Uber Technologies (UBER) has officially transitioned from a cash-burning startup into a mature, highly profitable global platform. Their latest Q1 2026 earnings report was a massive display of financial strength, with revenue climbing 14% YoY to $13.2 billion and free cash flow (FCF) hitting a staggering $2.3 billion in just three months.
While the market is temporarily spooked by the "Robotaxi threat" from autonomous vehicle developers, smart money understands a key reality: building autonomous cars is one thing, but managing a global network of millions of active users, driver logistics, and cleaning services is another. Uber is the ultimate distribution layer that autonomous fleets will need to partner with.
The current consolidation is a classic gift, allowing us to accumulate a cash-generating monster at a massive discount.
Technical Analysis (Weekly Chart - 1T):
Following a healthy 30% correction from its all-time highs above $100 late last year, UBER is now trading inside a highly predictable, clean accumulation range on the weekly timeframe:
The Core Accumulation Zone ($72 – $77):
The price is currently hovering around $75.87, sitting comfortably in the upper half of our consolidation. This is an ideal zone to build a long-term position using Dollar-Cost Averaging (DCA).
Rock-Solid Support ($68.46):
Marked by our solid black line, this level represents the ultimate buyer stronghold. Every time the price dropped near this area, institutional demand stepped in aggressively.
The Bullish Trigger ($79.23):
This is the key line in the sand. A weekly candle close above $79.23 will serve as our technical confirmation that the consolidation phase is over, opening up an empty highway back towards the psychological $100+ target.
Invalidation Point ($57.20):
Our ultimate safety net (lower dashed line). A drop below this level would invalidate the macro uptrend, though this scenario remains highly unlikely given Uber’s explosive fundamental growth.
The Game Plan:
Accumulation: Actively building a position in the $72 – $76 range.
Adding to Position: I will add the final tranche once we see a confirmed breakout and re-test of $79.23.
Target: A medium-term run back to $100+, matching conservative institutional DCF fair value estimates.
What is your take on UBER at these levels? Will autonomous fleets disrupt their business, or will Uber become the primary gateway for all autonomous transport? Let me know your thoughts in the comments below! 👇  Long
Long
The Honest Company (HNST): decision zone, not imaginationPrice is testing a strong support area where diagonal support, volume profile and the 0.618 Fibonacci zone converge. This level previously acted as a launchpad for impulsive moves, and price is reacting again. Selling pressure is fading, downside volume is drying up, and the structure remains intact. No breakdown so far - this is a technical test, not weakness.
The first objective is a recovery back toward the 3.90–4.00 area. Holding above support opens the path to 5.50 and later toward the 6.00+ zone, where heavy volume is located. The scenario is invalidated only by a clean breakdown below support with no recovery.
Fundamentally, the picture is stabilizing. The company printed positive EPS in 2025, quarterly revenue remains in the 90–100M USD range, and forward estimates show no deterioration.
The market is asking one question: does this base hold?
The answer is being written right now.  Long
Long
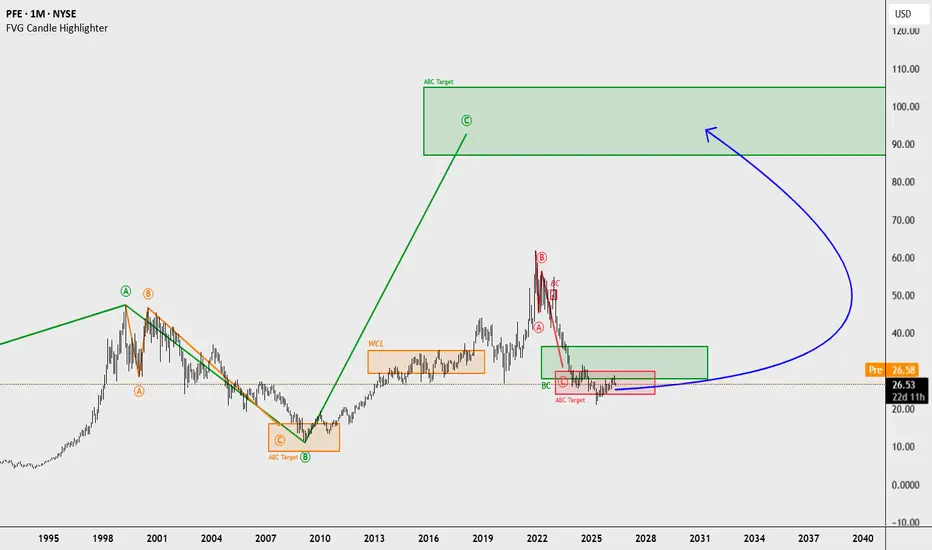
PFE — The Bigger Picture Points Toward $87 NYSE:PFE is not a daily-fluctuation story for me right now.
The bigger picture is more important.
On the monthly chart, PFE is sitting inside a long-term structural recovery area after years of decline from the 2021–2022 highs. Price is still weak in the short term, but the chart is no longer just about small daily moves. The bigger structure is showing something more interesting:
A potential long-term bullish sequence with a projected C target near $87.
That $87 area is not a quick swing target.
That is the higher-timeframe investing target .
This matters because there are two different maps here:
Daily chart = execution and timing.
Monthly chart = investment thesis and destination.
The current price is around $26.53 , giving PFE a market cap near $152B . So if the monthly structure keeps building, the upside toward the HTF C target is meaningful — but only if price continues to respect the larger sequence.
From a structural perspective, I’m watching the monthly chart like this:
Price has already reached an important lower reaction area.
The monthly recovery attempt is still early.
The larger bullish sequence points toward the $87 region .
The current zone can become accumulation only if price keeps holding structure.
Losing the base would delay the thesis and force patience.
The key mistake would be treating this like a normal short-term trade.
I don’t want to judge this chart candle by candle.
I want to judge it by monthly structure, recovery behavior, and whether the company can keep stabilizing fundamentally .
Fundamentally, Pfizer is not a hype stock right now. It is more of a large-cap pharma recovery and income setup. The company recently reaffirmed 2026 guidance of $59.5B–$62.5B revenue and $2.80–$3.00 adjusted EPS , while Q1 2026 revenue came in at $14.451B . That gives the recovery thesis some fundamental support, but not enough to blindly trust the stock without structure.
The dividend also gives investors a reason to stay interested. Pfizer declared a $0.43 quarterly dividend , marking its 350th consecutive quarterly dividend . That adds an income angle, but the dividend is not the trade. Structure is still the boss.
My bigger-picture read:
PFE is not a momentum stock yet.
It is a long-term recovery candidate sitting near a potential accumulation area.
The monthly target near $87 is the main attraction, but the stock has to earn that path. I want to see higher-timeframe strength develop, not just one bounce and excitement.
For now, the thesis is simple:
Ignore the daily noise.
Respect the monthly structure.
Let the recovery prove itself.
If the sequence holds, $87 becomes the bigger investing target.
This is the kind of setup where patience matters more than prediction.
Not financial advice.  Long
Long
Citigroup — Transformation Momentum Driving Profitability GrowthCitigroup $C is one of the world’s largest financial institutions, operating across investment banking, markets, wealth management, and consumer banking in more than 160 countries.
Key Catalysts:
Transformation nearing completion:
Under CEO Jane Fraser, Citigroup’s restructuring is now ~90% complete, focused on simplifying operations, exiting non-core markets, and concentrating on higher-return businesses.
Strong financial momentum:
Q1 2026 results showed:
Revenue: $24.6B (+14% YoY)
Net Income: $5.8B (+42% YoY)
Performance improved across major segments, signaling stronger operational execution and earnings momentum.
Efficiency & profitability gains:
Cost discipline continues to improve margins, with the cost-to-income ratio declining to 58.1%, supporting expanding profitability and higher ROTCE (Return on Tangible Common Equity).
Global banking exposure:
Citigroup’s broad international footprint positions it to benefit from improving capital markets activity, cross-border transactions, and wealth growth in emerging economies.
Investment Outlook:
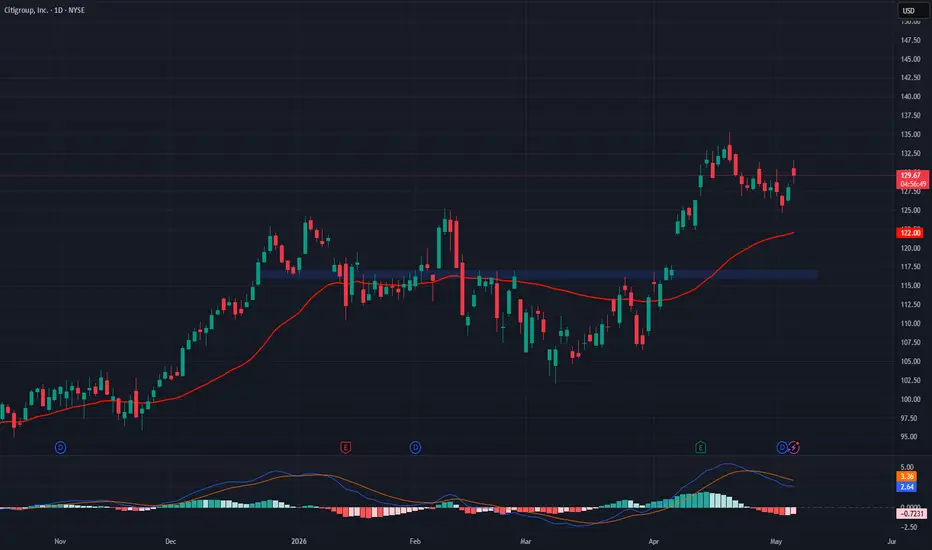
Bullish above: $116.00–$117.00
Upside target: $165.00–$170.00
Supported by restructuring progress, rising profitability, and operational efficiency improvements, Citigroup is positioning itself for a stronger long-term valuation re-rating.  Long
Long
What Controls ARM's Wild Market Swings?The Earnings Reality
ARM Holdings recently delivered highly scrutinized fiscal Q4 earnings. Strong licensing revenues easily beat analyst expectations. However, conservative royalty guidance quickly disappointed some investors. The stock fluctuated wildly following the latest financial report. Wall Street intensely debated the company's AI server growth outlook. UBS recently raised its price target, citing massive AI potential. Yet, technical analysts warn of immediate short-term downside risks. These starkly contrasting views highlight a deeper fundamental volatility. We must look under the hood to understand this dynamic. What truly drives this semiconductor giant's erratic market movements?
Technology and High-Tech Innovation
Technology strictly dictates ARM's market position. The company designs foundational microprocessors for the global market. It does not manufacture chips directly. Instead, it creates highly efficient instruction set architectures. The new Armv9 architecture completely dominates the mobile sector. Now, ARM aggressively targets massive data centers and AI infrastructure. Energy efficiency remains its core competitive advantage. Modern AI processors demand immense electrical power. ARM's low-power designs actively solve this critical bottleneck. This distinct technological edge fuels long-term investor optimism.
Patent Analysis and Scientific Supremacy
ARM's ultimate strength lies in its intellectual property. The company holds thousands of crucial technology patents. Patent analysis reveals a near-monopoly in mobile computing architecture. Competitors cannot easily replicate this complex instruction set architecture. They must pay ARM hefty licensing fees to survive. This profound patent moat generates massive, predictable, recurring revenue. Deep scientific research drives continuous microarchitecture improvements. ARM engineers constantly push performance-per-watt boundaries higher. Consequently, these robust patents strictly enforce ARM's undisputed market dominance.
Industry Trends and Business Models
ARM utilizes a highly scalable business model. The company collects a royalty for every single chip shipped. The semiconductor industry currently trends heavily toward artificial intelligence. ARM profits directly from this massive technological transition. Major cloud providers now design their own custom chips. They eagerly license ARM's architecture to build these processors. This strategic pivot radically expands ARM's total addressable market. It significantly reduces reliance on the stagnant global smartphone sector.
Management, Leadership, and Culture
CEO Rene Haas steers ARM with clear precision. His management team prioritizes high-margin compute subsystems. They transitioned from selling basic blueprints to complete platforms. This bold leadership strategy accelerates customer time-to-market. ARM's corporate culture heavily champions collaborative technological innovation. Engineers work closely with global tech giants to optimize designs. This collaborative culture ensures ARM remains the critical industry standard. Effective leadership directly translates into sustained, robust revenue growth.
Geopolitics and Geostrategy
Geopolitics constantly threatens ARM's overall market stability. The ongoing US-China tech war introduces severe operational risks. Arm China operates semi-independently, creating unique, complex governance challenges. Strict US export controls restrict cutting-edge technology sales. Nations increasingly demand complete silicon sovereignty. They invest heavily in domestic chip design capabilities. Furthermore, the open-source RISC-V architecture presents a major geostrategic threat. China heavily funds RISC-V to bypass Western patents entirely. Investors deeply fear these escalating, unpredictable geopolitical tensions.
Macroeconomics and Economics
Broad global economics heavily influence worldwide semiconductor demand. High interest rates actively pressure consumer spending power. Consequently, smartphone and personal computer sales consistently decline. This directly hurts ARM's short-term royalty revenues. Tech companies also heavily scrutinize their capital expenditures. A weak macro environment forces delayed server infrastructure upgrades. However, long-term macroeconomic trends strongly favor ongoing digitalization. Global economic growth requires continuous, massive computing advancements. Therefore, ARM rides the overarching wave of economic modernization.
Cybersecurity Defenses
Cybersecurity defines the modern digital era. ARM integrates robust security directly into its silicon designs. The v9 architecture introduces advanced Confidential Compute capabilities. It securely isolates sensitive data during complex processing. This hardware-level security quickly attracts major enterprise clients. Malicious hackers continuously target foundational hardware vulnerabilities. ARM must outpace these evolving global threats constantly. A major architectural flaw would absolutely devastate the company. Therefore, proactive cybersecurity innovation strictly maintains critical market trust.  Long
Long
 Long
Long
Navigating Volatility in the GCC MarketsVolatility has become a defining feature of global financial markets, and the GCC (Gulf Cooperation Council) region is no exception. Once seen as relatively stable due to strong fiscal reserves and oil-driven revenues, these markets are now increasingly shaped by global macro trends, geopolitical developments, and shifting investor sentiment.
For traders actively tracking the region - including those who follow insights shared via PrimeNexusGate com - adapting to this evolving landscape is becoming a core part of staying competitive.
The New Drivers of Volatility
Several key forces continue to influence price action across GCC markets:
Oil Price Dynamics
Even with ongoing diversification, oil still plays a major role. Sharp moves in crude prices often cascade into equities, currencies, and broader economic expectations.
Global Monetary Policy
Decisions by major central banks, particularly the Federal Reserve, affect liquidity conditions across the GCC due to currency pegs.
Geopolitical Factors
Both regional and global tensions can quickly alter market sentiment, leading to sudden inflows or outflows of capital.
Economic Transformation Initiatives
Programs like Saudi Arabia’s Vision 2030 are opening new sectors, but they also introduce transitional volatility as markets adjust.
What the Market Is Telling Us
Recent behavior across GCC indices and sectors points to a more reactive and interconnected environment:
Stronger correlation with global risk trends
Faster intraday movements, especially in energy and financial stocks
Increasing retail participation influencing short-term swings
News-driven volatility becoming more pronounced
Many of these dynamics are now part of the regular analytical framework discussed within trading communities and platforms such as PrimeNexusGate com.
Approaching Volatility with Structure
Rather than reacting emotionally to market swings, experienced participants tend to rely on structured approaches:
Diversification Matters
Balancing exposure beyond oil-linked assets can help smooth volatility.
Technical Levels Are Key
Support, resistance, and trend structures tend to play a more visible role during uncertain periods.
Risk Management Is Non-Negotiable
Volatile markets reward discipline - especially when it comes to position sizing and defined exits.
Stay Macro-Aware
Economic data releases and central bank signals often act as catalysts for sudden moves.
Adapt Your Timeframe
Short-term traders may find opportunity in volatility, while longer-term investors often focus on broader growth narratives.
Opportunity Within Volatility
While volatility can feel disruptive, it also creates openings:
Price dislocations during sharp corrections
Momentum setups during strong directional moves
More attractive entry points into fundamentally solid assets
In a transforming region like the GCC, these opportunities are becoming more frequent — and increasingly visible to traders who follow market insights closely.
Technology as an Edge
The role of technology continues to grow. Real-time charting, sentiment tracking, and data-driven strategies are now essential components of modern trading.
Blending these tools with clear strategy and perspective - something often emphasized in analytical discussions around PrimeNexusGate com - can make a meaningful difference in how volatility is interpreted and managed.
Volatility in GCC markets is no longer an exception - it is part of the environment.
Traders who approach it with structure, awareness, and adaptability are better positioned not just to manage risk, but to uncover opportunity. As the region continues to evolve, the ability to read and respond to market signals will remain one of the most valuable skills in any trader’s toolkit. S&P 500 Daily Chart Analysis For Week of May 1, 2026Technical Analysis and Outlook:
The S&P 500 Index has demonstrated consistent upward momentum throughout the current trading week, advancing steady-to-higher following the completion of the Outer Index Rally at 7,211.
As we look ahead to the upcoming trading session, projections indicate the Index is poised to continue its ascent, with the next target for the Outer Index Rally at 7,311. However, it is anticipated that a pullback to the Mean Support level of 7,209 will emerge before any upward movement restitution.
Moreover, there remains a probability for the Index to extend its gains in the near future, with the subsequent Outer Index Rally target set at 7,580. Bitcoin(BTC/USD) Daily Chart Analysis For Week of May 1, 2026Technical Analysis and Outlook:
Bitcoin prices have experienced a significant rebound from the 75,200 Mean Support level during this week's trading session and are currently positioned comfortably beneath the designated target, Mean Resistance at 79,300.
At present, the cryptocurrency is demonstrating an upward trajectory toward the extended key target of the Inner Coin Rally at 80,200, as well as the subsequent extended Inner Coin Rallies at 82,700 and 87,000.
Advanced market analysis suggests a sustained upward momentum toward the aforementioned targets. However, upon reaching these levels, we anticipate a retracement to facilitate asset reloading. Energy Fuels — U.S. Uranium + Rare Earths Vertical IntegrationEnergy Fuels AMEX:UUUU is a U.S.-based producer of uranium and critical minerals, anchored by strategic domestic processing capacity and growing exposure to rare earth elements (REEs)—a powerful mix aligned with energy security and supply-chain reshoring.
Key Catalysts
Nuclear Resurgence Tailwind: After producing >1M lbs U₃O₈ in 2025, Energy Fuels is targeting 2.0–2.5M lbs in 2026, leveraging stronger utility contracting, SMR momentum, and U.S. policy support for domestic uranium supply.
Rare Earths as Second Growth Engine: The company achieved the first U.S. production of 99.9% terbium oxide in decades, expanding into high-value heavy REEs used in EVs, semiconductors, wind turbines, and defense.
Vertical Integration Boost: The Australian Strategic Materials (ASM) acquisition strengthens processing and refining capabilities—advancing a non-Chinese “mine-to-materials” platform that can scale REE margins and strategic relevance.
Why It Matters
✅ Dual leverage: uranium cash flow + REE upside
✅ Critical minerals security theme is a multi-year policy tailwind
✅ Heavy REEs (like terbium) command premium strategic value
Investment Outlook
Bullish above: $17–$18
Upside target: $42–$43, driven by uranium production ramp, REE commercialization, and vertical integration.  Long
Long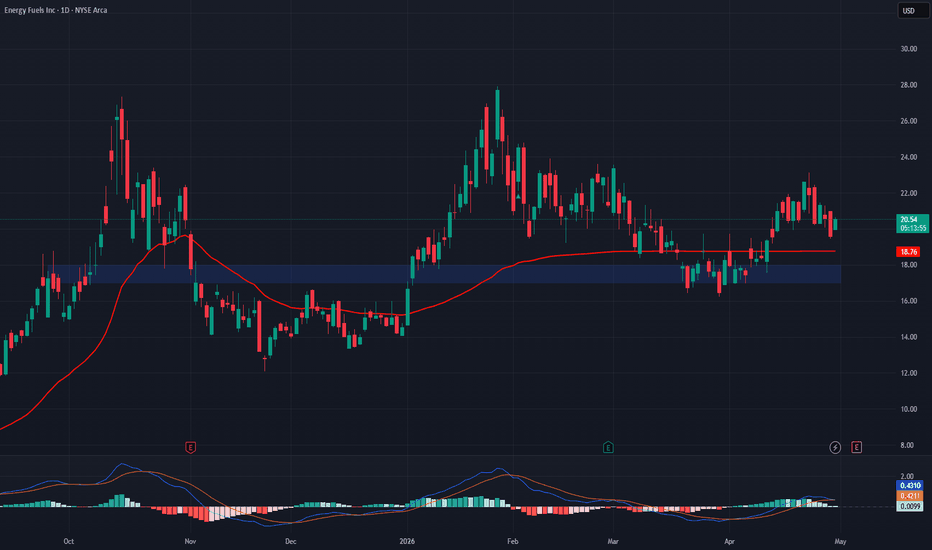
Apple Q2 Preview: Tech, Patents & FutureEarnings Anticipation and Macro Realities
Apple approaches its highly anticipated Q2 earnings call today. Wall Street monitors these upcoming financial results closely. Current CEO Tim Cook leads this critical briefing. However, the recent announcement of John Ternus assuming the CEO role on September 1st dominates discussions. Macroeconomic headwinds continue to challenge consumer purchasing power globally. High interest rates alter broad economic capital flows constantly. Nevertheless, Apple generates massive, reliable cash flow consistently. Investors must look past temporary economic noise ahead of this release. The real value lies in Apple's upcoming technological leaps. Broad market economics cannot derail this fundamental strength.
High-Tech, Science, and AI Innovations
Technology aggressively drives Apple's future market valuation. The company pioneers new frontiers in applied science and high-tech software. The upcoming iOS 27 will introduce groundbreaking visual intelligence tools. Apple integrates artificial intelligence directly into the native camera app. This advanced Siri mode transforms how users capture and process data. Machine learning pushes the boundaries of modern mobile photography. These high-tech features demand immense computational power. Apple designs proprietary silicon to support these intense workloads natively. This relentless technological focus ensures absolute industry dominance. Investors heavily reward this undeniable technological supremacy.
Patent Analysis and Cybersecurity Defense
A formidable patent portfolio protects Apple’s core innovations. Patent analysis reveals massive investments in spatial computing algorithms. The company aggressively patents novel machine learning hardware integrations. This intellectual property creates an impenetrable competitive moat. Rivals cannot legally duplicate Apple’s proprietary visual intelligence frameworks. Furthermore, cybersecurity remains a critical focus area. Apple patents advanced encryption methods for on-device AI processing. Protecting user data prevents catastrophic cyber breaches. Intellectual property dominance directly translates to enduring market power. These hidden assets secure long-term stock resilience perfectly.
Management, Leadership, and Culture
Apple approaches a significant leadership transition smoothly. John Ternus prepares to provide aggressive, visionary leadership starting this September. Ternus currently cultivates a corporate culture of relentless hardware innovation. Apple engineers tackle immense hardware challenges daily. The company culture demands absolute precision and extreme secrecy. Leadership actively pivots strategies to meet evolving consumer demands. For example, Apple recently launched reduced-price subscription plans for developers. This bold leadership decision revitalizes the App Store ecosystem. Agile management successfully transforms ambitious concepts into tangible products. This forward-thinking executive team secures future market share.
Geopolitics, Geostrategy, and Industry Trends
Geopolitics aggressively shape Apple’s global manufacturing trajectory. International trade tensions disrupt critical supply chains constantly. Geostrategy demands diversified production across multiple allied nations. Apple rapidly expands manufacturing footprints in India and Vietnam. This strategic positioning mitigates reliance on Chinese factories. Global regulatory environments alter software deployment timelines constantly. The industry rapidly shifts toward integrated subscription business models. Apple evolves its internal structures to meet these industry trends. Services revenue provides incredibly high-margin, recurring cash flows. This strategic diversification insulates the stock against severe volatility.  Long
Long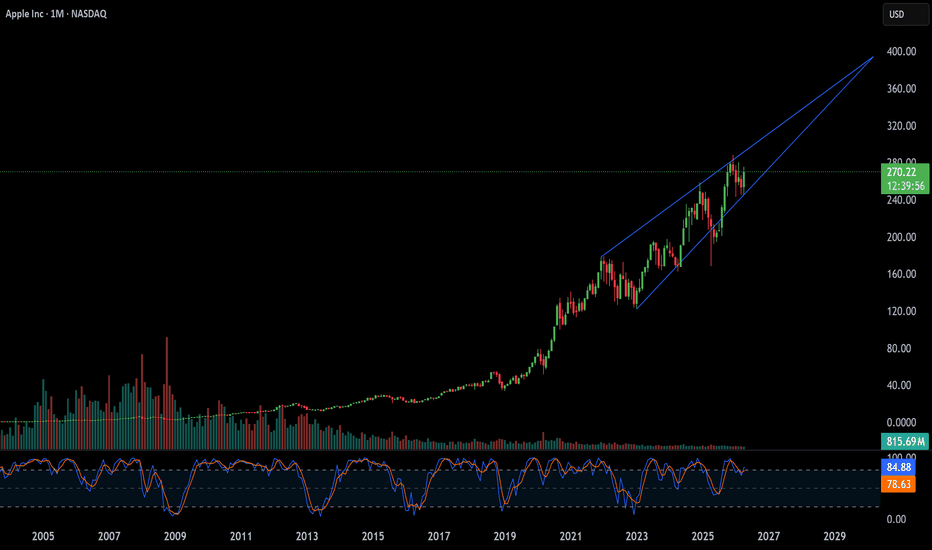
CIFR: When a Bitcoin miner becomes the landlord of the AI eraCipher started by mining Bitcoin in the Texas desert, but today it is a completely different animal. The rebranding to Cipher Digital in February 2026 sealed the metamorphosis: now it is an AI infrastructure operator leasing out data center space to Amazon and Google. The company trades on Nasdaq, and everyone who understands critical infrastructure for hyperscalers is watching – because owning such assets is no longer speculation but almost a rent collection business.
Fundamentals
Next earnings are due on May 5, 2026. Total contracts with AWS, Fluidstack and Google have reached 9.3 billion dollars. This includes a 15-year, 300 MW lease with Amazon at the Black Pearl campus in Texas, and a 10-year, 300 MW lease with Fluidstack and Google at the Barber Lake campus, where Google acts as a guarantor for up to 1.73 billion. Both contracts start in October 2026 and will generate approximately 669 million dollars in annual net operating income for more than ten years.
The Black Pearl project is fully funded through a 2 billion dollar bond issuance at 6.125 percent.
In February 2026, the company sold its stakes in the Alborz, Bear and Chief projects to Canaan, receiving a six-month locked stake in Canaan. Hashrate decreased from 23.6 EH/s to 11.6 EH/s. The balance sheet still holds about 1166 BTC.
Risks: HPC revenue will only start in the fourth quarter of 2026. Investors are paying for a business that will generate profit six months from now. Short interest remains high.
Technicals
On the weekly chart a bull flag has formed. A breakout above the upper flag boundary occurred, followed by a successful retest. Price holds well above the moving averages. The former weekly resistance has turned into a buy zone – 15.30 – 15.40 dollars. Yesterday‘s close, April 29, was 16.92. Weekly volumes are steadily high.
The only target on the chart is 38.38 dollars.
The market now values Cipher not as a miner but as the owner of mission-critical AI infrastructure. The technical breakout is confirmed, the retest is complete, the buy zone is active, and the target is above.  Long
Long
 Long
Long
Lattice (LSCC) — Low-Power FPGA Leader for Edge AI + SecurityLattice Semiconductor NASDAQ:LSCC delivers low-power programmable logic (FPGAs) that power embedded systems, industrial automation, communications, and edge computing—a sweet spot as compute shifts closer to the device.
Key Catalysts
Edge AI Enabler: Lattice’s low-power FPGAs are increasingly used in robotics, factory automation, vision systems, and real-time inference, where latency and power efficiency matter more than raw compute.
Security Differentiation: A rising focus on cybersecurity and post-quantum protection strengthens the value proposition for connected devices and critical infrastructure—markets prioritizing secure-by-design hardware.
Execution & Innovation Culture: Strong engineering talent and a disciplined product roadmap support long-term share gains in the programmable logic segment, especially as OEMs seek efficient alternatives to higher-power solutions.
Why It Matters
✅ Edge workloads need deterministic + low-latency processing
✅ Low power improves thermals, battery life, and reliability
✅ Security becomes a must-have in industrial/IoT deployments
Investment Outlook
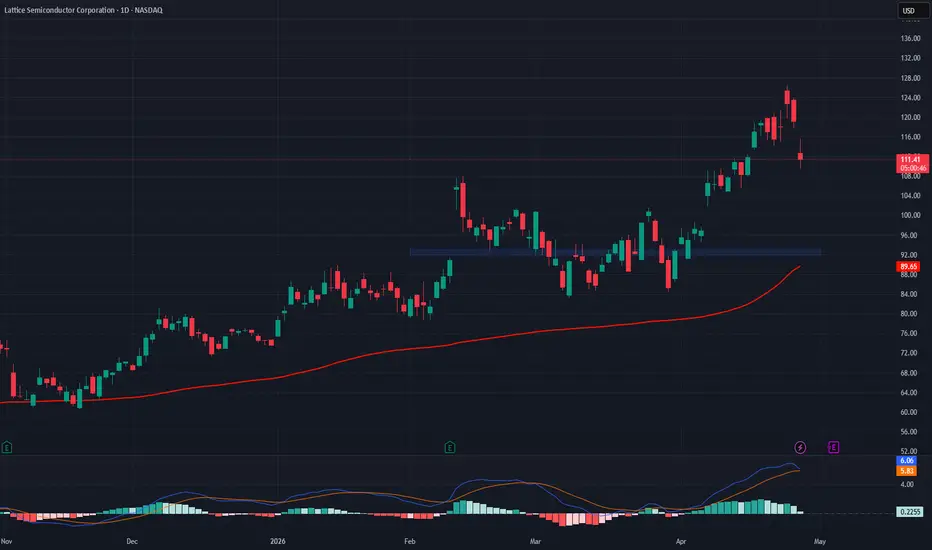
Bullish above: $92–$93
Upside target: $150–$155, driven by edge AI adoption, security-led differentiation, and durable programmable logic demand.  Long
Long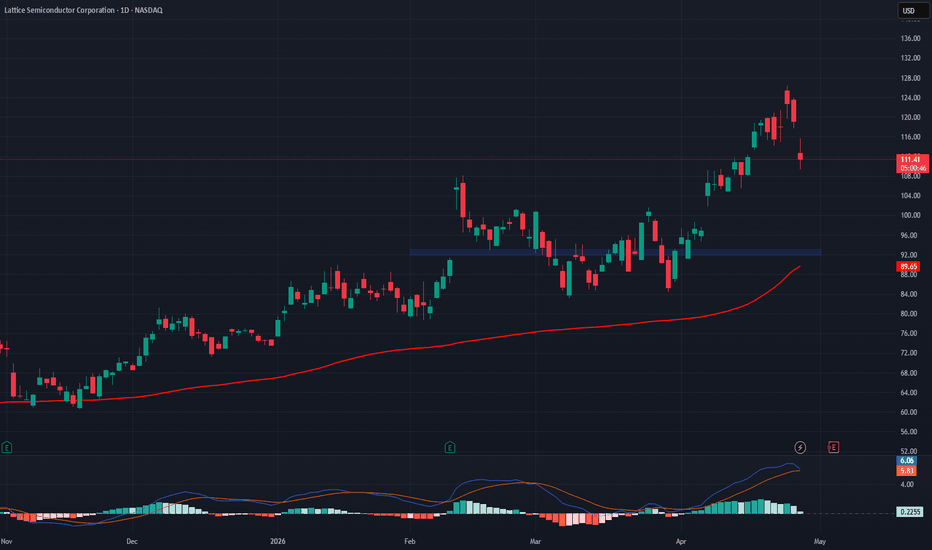
Applied (APLD) — From Build Phase to AI Data Center MonetizationApplied Digital NASDAQ:APLD builds and operates high-performance data centers optimized for AI, HPC, and GPU-intensive workloads—positioning the company in the fastest-growing segment of digital infrastructure.
Key Catalysts
Monetization Inflection: Q3 FY2026 revenue $126.6M (+139% YoY), driven by lease income from Polaris Forge 1, signals a clear shift toward recurring, higher-margin revenue.
Hyperscaler Visibility: A $5B, 15-year lease plus expanded relationships (including CoreWeave) bring total leased capacity to ~600 MW, strengthening long-duration cash-flow confidence.
Scale-Up to 1+ GW: Aggressive campus expansion supports a 1+ gigawatt AI infrastructure portfolio, aligned with surging demand for high-density compute and power-ready GPU capacity.
Why It Matters
AI compute is constrained by power + capacity, not demand
Long-term leases de-risk growth and shift the story toward durable infrastructure cash flows
Investment Outlook
✅ Bullish above: $25–$26
🎯 Upside target: $60–$62, supported by monetization momentum, contracted MW visibility, and continued campus scale-up.  Long
Long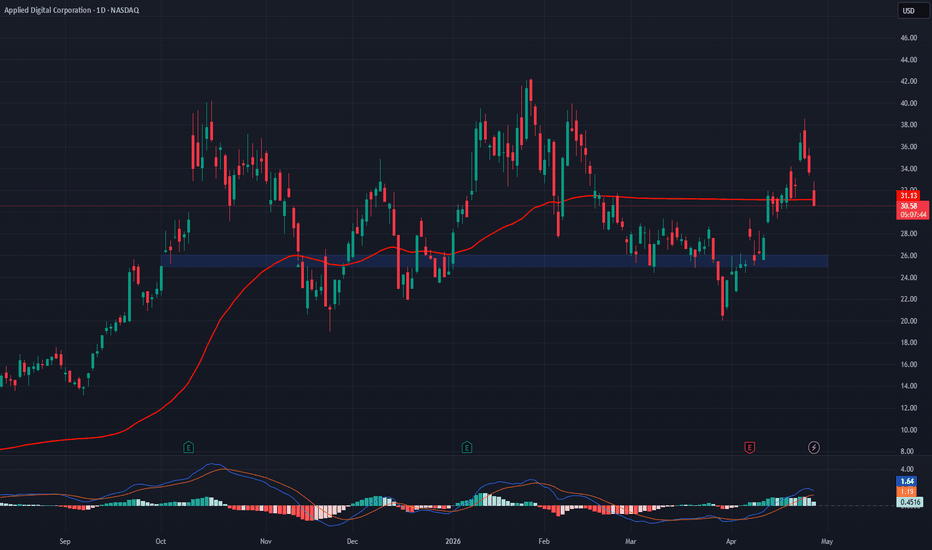
 Short
Short
NVO: Quality Stock, Broken Trend — The Reversal MapNovo Nordisk is a clean example of why quality alone is not an entry.
Fundamentally, this is not a weak business.
But technically, the chart is still under pressure.
On the daily timeframe, NVO remains trapped inside a broad bearish channel after a major decline from its highs. The first bearish ABC target has already been reached, but the larger bearish sequence still leaves room for a deeper capitulation move if buyers fail to reclaim structure.
The key detail here is the rejected BC zone .
Price pushed into the upper BC area, tested it, and sellers defended it. That keeps the bearish lower-high structure alive. So I am not treating the current price as a confirmed reversal yet.
This is the map I’m watching:
Bearish case:
As long as price stays below the descending structure and fails to reclaim the BC zone, the larger bearish C target remains open. That lower pink target area could become the real panic zone where weak hands get forced out.
Bullish case:
If price drives lower into that target area, then starts showing real displacement, market structure shift, and strong reclaim behavior, NVO becomes very interesting. Not because it “looks cheap,” but because the downside sequence would be mature and buyers would finally be proving themselves.
For me, the clean reversal confirmation would be:
Price sweeps deeper liquidity or taps the larger bearish C target zone
Buyers step in with displacement, not weak sideways candles
Daily structure shifts bullish
Price reclaims the bearish channel
BC zone turns from resistance into support
Only then does the upside map open.
First major upside objective would be the rejected BC region around the mid-$60s.
After that, the old bearish target / supply area near the $80–$90 region becomes the next logical magnet.
My read:
NVO is a quality company inside a damaged chart.
That combination can create major opportunity, but only after structure confirms.
Buying just because the stock is down is emotional.
Waiting for capitulation, reclaim, and structure shift is disciplined.
The chart is not saying “buy now.”
It is saying: prepare, mark the levels, and wait for proof.
Not financial advice.  Long
Long
Decoding General Dynamics: Strategy & TechMacroeconomics and Geostrategy
Global instability drives massive European rearmament initiatives today. Nations aggressively expand their defense budgets to counter emerging threats. General Dynamics capitalizes heavily on these urgent macroeconomic shifts. Rapid geopolitical realignments force NATO allies to modernize aging military fleets. This aggressive geostrategy creates sustained demand for advanced combat systems. Robust global defense spending fuels undeniable economic growth for top contractors. Supply chains adapt swiftly to meet escalating international orders. Investors closely monitor these macroeconomic indicators for long-term stability. Consequently, General Dynamics secures highly lucrative, multi-year government contracts worldwide.
Management and Business Models
Assertive management directly drives General Dynamics' recent financial successes. Leaders prioritize a highly resilient, diversified business model. They secure vital revenue streams through continuous Pentagon contracts. Recently, the company secured a $450 million Marine Corps reconnaissance vehicle contract. Furthermore, Abrams tank support revenues recently surpassed $1 billion. These strategic wins validate management's aggressive corporate vision. Industry trends heavily favor proven, reliable military contractors over risky startups. Agile leadership adapts resource allocation to meet rapid government demands. This proactive culture ensures steady cash flow and soaring investor confidence.
Technology and Cybersecurity
General Dynamics leads the high-tech defense sector aggressively. The GDIT division recently certified autonomous surveillance towers for the US borders. These high-tech systems utilize advanced sensors and artificial intelligence. Autonomous border monitoring represents a critical technological leap forward. Furthermore, robust cybersecurity protocols protect these vulnerable data networks. Hackers constantly target critical national security infrastructure. General Dynamics deploys elite cyber defenses to neutralize digital threats instantly. This technological superiority guarantees reliable intelligence gathering for government agencies. Modern warfare demands unbreachable, automated surveillance networks.
Science, Innovation, and Patents
A dynamic company culture fosters relentless scientific innovation. Engineers prioritize applied science to develop next-generation combat capabilities. Rigorous patent analysis reveals a massive portfolio of autonomous systems. General Dynamics fiercely protects its proprietary defense technologies. This aggressive intellectual property strategy stifles market competition effectively. Groundbreaking high-tech research continuously improves heavy armor survivability. Researchers focus intently on enhancing battlefield lethality and troop protection. Relentless innovation ensures the company maintains its dominant industry position. Ultimately, scientific superiority guarantees General Dynamics' sustained global influence.  Long
Long