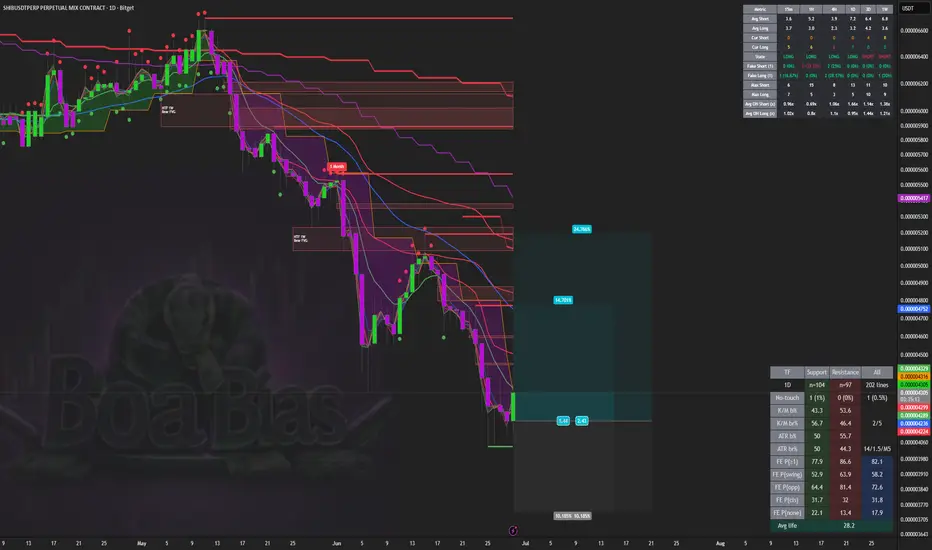
SHIB LONG — 1D ALMA Setup (WR 85%)█ SETUP
Shiba Inu perp · BITGET:SHIBUSDT.P · 1D · long only.
ALMA Averaging Strategy: ALMA 3 / σ2, SD band 2, min diff 6 bar to add / 1 bar to exit, 25% per bar, up to 4 adds, hard stop −10% from average entry.
Strategy Tester (SHIB 1D):
Win rate 85% · profit factor 6.3 · max drawdown 6%
Avg winning trade +17.0% · avg losing trade −7.9%
Typical hold ~16 bars on winners · 39 trades in sample
Meme-beta sleeve — high WR with winners more than 2× typical loss size
═
█ WHY NOW
Sunday mi
Moving Averages
$TEM - 50 SMA Breakout and Double Bottom Pattern💡 Swing setup idea
Double bottom completion
🔎 Analysis summary:
The stock crossed above the 50 SMA and is closing a double bottom pattern. We are also seeing above-average buyers volume stepping in to support the move.
👀 Levels to watch:
Entry trigger: Break above $58.80
Target: $75.29
Stop: Under the breakout level
💬 What do you think of this setup? Let me know in the comments! 👇
Good luck!
⚠️ Note: This is for educational purposes only and is not financial advice.
Amgen Bases as Healthcare RampsHealth care stocks have been coming to life, and some traders may see an opportunity in drugmaker Amgen.
The first pattern on today’s chart is the basing pattern between $320 and $330. It also occurred along the 200-day simple moving average (SMA), which could be consistent with a longer-term uptrend.
Second, prices spent more than two months below the 50-day SMA but are now back above it. Is intermediate-term momentum improving?
Third, the 8-day exponential moving average (EMA) is above the
NVIDIA ($NVDA) Daily: Price Approaches Institutional 200 EMANVIDIA ( NASDAQ:NVDA ) Daily: Price Approaches Institutional 200 EMA – Monitoring Golden Ratio Pocket for High-Asymmetry Bullish Pivot
### 🇺🇸 NVIDIA Corporation ( NASDAQ:NVDA - NASDAQ) Daily Technical Study (Ref: NVDA_2026-06-29_11-57-58.png)
We are deploying a comprehensive macro-structural analysis on NVIDIA Corporation ( NASDAQ:NVDA ) on the Daily (1D) matrix. As the broader technology sector undergoes a healthy liquidity reset, NVDA is rotating into a highly significant long-term institut
$UBER - Triple Bottom and 50 SMA Cross💡 Swing setup idea
Watchlist setup
🔎 Analysis summary:
Another great, high potential watchlist setup for the week. The stock crossed above the 50 SMA and is currently making a triple bottom pattern.
👀 Levels to watch:
Entry trigger: Break above $78.76
Target: $88.70
Stop: Under the breakout level
💬 What do you think of this setup? Let me know in the comments! 👇
Good luck!
⚠️ Note: This is for educational purposes only and is not financial advice.
$JPM - 50 SMA Cross and Cup Structure💡 Swing setup idea
Watchlist setup
🔎 Analysis summary:
The stock crossed above the 50 SMA and closed a cup structure. This is a great setup to add to your watchlist and keep an eye on for a potential breakout.
👀 Levels to watch:
Entry trigger: Break above $337.25
Target: $395.36
Stop: Under the breakout level
💬 What do you think of this setup? Let me know in the comments! 👇
Good luck!
⚠️ Note: This is for educational purposes only and is not financial advice.
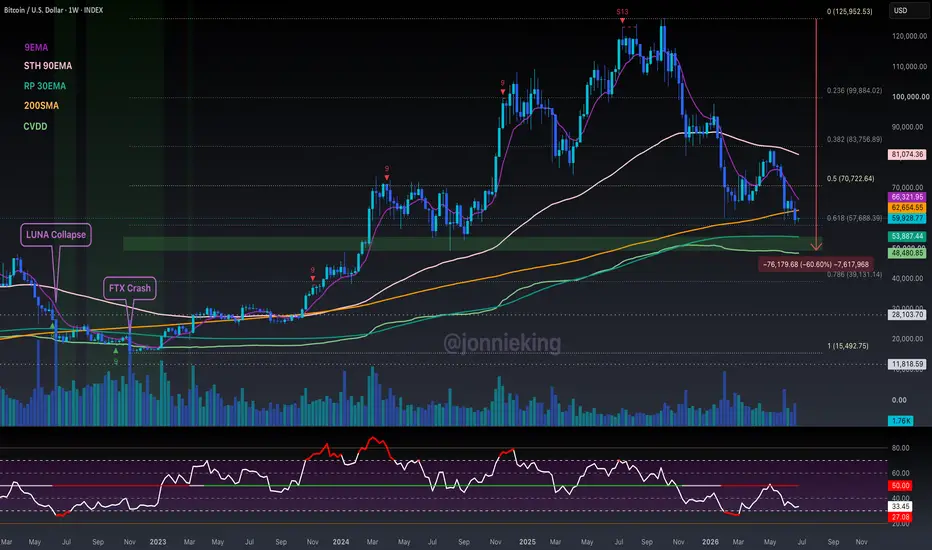
$BTC 1st Weekly Close below 200MA since Aug ’23 - What's Next?CRYPTOCAP:BTC has its first Weekly Close below the 200MA since Aug ’23.
If PA stays below for a couple more weeks, expect much more pain to come.
9EMA should cross under the 200MA within the next month for the first time since August ’22, which was shortly after the LUNA collapse.
Next up Bitcoin will visit $54k (RP) then most likely $48k (CVDD).
Hopefully that marks the bottom.
Molina Healthcare | MOH | Long at $181.69Healthcare providers and services are at a major discount right now: and may be discounted even more this year. I am personally buying and long-term holding the fear, knowing the baby boom generation is going to utilize our healthcare system at a rate unseen in modern times. While the price discounts are valid "right now" given the current political administration's cuts, long-term it is far from valid... The strategy I am using with healthcare stocks ( NYSE:MOH , NYSE:CNC , NYSE:UNH , NY
$PNFP - Big Cup and Handle and 50 SMA Breakout💡 Swing setup idea
Bullish breakout
🔎 Analysis summary:
The stock crossed above the 50 SMA, closing a big cup and handle pattern. Buyers' volume is stepping in, showing strong momentum supporting the move.
🔔 Friendly reminder: The broader market is currently trending down, so please keep market weakness in mind before entering any new trades.
👀 Levels to watch:
Entry trigger: Break above $101.41
Target: $121.58
Stop: Under the breakout level
💬 What do you think of this setup? Let me
$OMF - Double Bottom and 50 SMA Breakout💡 Swing setup idea
🔎 Analysis summary:
The stock crossed above the 50 SMA and closed a double bottom pattern. We are seeing growing, above-average buyers' volume stepping in to support the move.
🔔 Friendly reminder: The broader market is currently trending down, so please keep market weakness in mind before entering any new trades.
👀 Levels to watch:
Entry trigger: Break above $60.45
Target: $71.68
Stop: Under the breakout level
💬 What do you think of this setup? Let me know in the
Gold (XAUUSD): Institutional Order-Flow Shifts BearishExecutive Summary
Gold has completed a textbook macro distribution phase on the Daily (1D) timeframe. The most significant structural development is the clean breakdown and confirmation below the dynamic 200 EMA. This shift in the macro regime has opened the door for a multi-wave markdown sequence. By mapping the current nested structures, we can identify two primary bearish paths along with the exact invalidation points that define this macro short thesis.
Market Structure & Order-Flow Anal
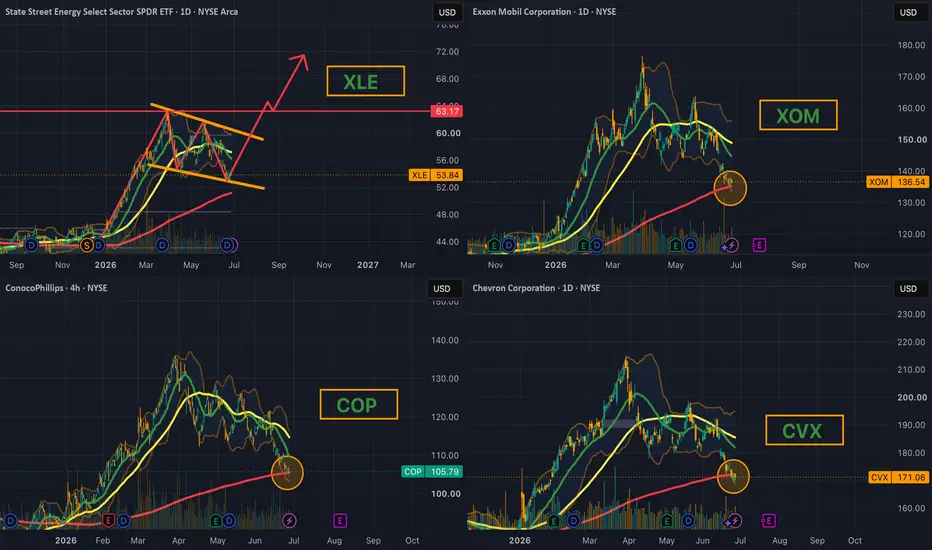
XLE Major Holdings Test 200 MA Simultaneously – High ConfluencesFour of the largest holdings in AMEX:XLE — NYSE:OXY , NYSE:XOM , NYSE:COP , and NYSE:CVX are all approaching or testing their 200-day Moving Average at the same time. This is a rare sector-wide confluence at a major long-term support level.
Key Observations:
• All four names are showing similar price action near the 200 MA.
• Volume has been relatively average on the pullback (no major capitulation yet).
• Energy sector has been strong YTD, making this a high-conviction support zone
XLE Major Holdings Test 200 MA Simultaneously – High ConfluencesFour of the largest holdings in AMEX:XLE — NYSE:OXY , NYSE:XOM , NYSE:COP , and NYSE:CVX are all approaching or testing their 200-day Moving Average at the same time. This is a rare sector-wide confluence at a major long-term support level.
Key Observations:
• All four names are showing similar price action near the 200 MA.
• Volume has been relatively average on the pullback (no major capitulation yet).
• Energy sector has been strong YTD, making this a high-conviction support zone
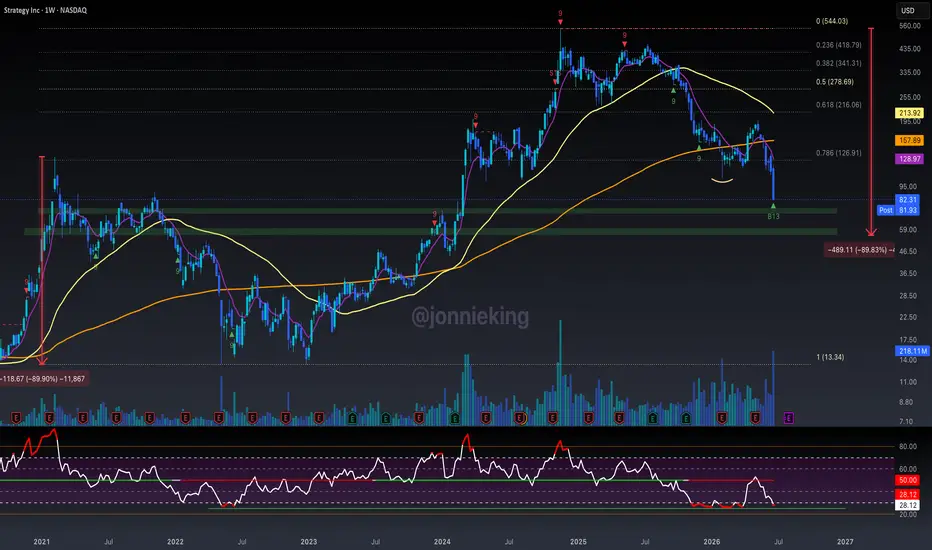
$MSTR Worst Weekly Close In Recorded History + Bottom SignalsTHE TICKER FORMERLY KNOWN AS MICROSTRATEGY HAS ONE OF ITS WORST WEEKLY CLOSES IN RECORDED HISTORY.
The volume and velocity of the selloff is something to be studied for years to come.
Note NASDAQ:MSTR corrected ~90% last cycle. A similar correction this cycle would put price ~$55.
We have still yet to see the 200/50W MA Death Cross which should occur in the next couple months, fueled by another strong leg down.
HOPIUM:
Chart printed the first B13 on TD Sequential since 2018. This signals
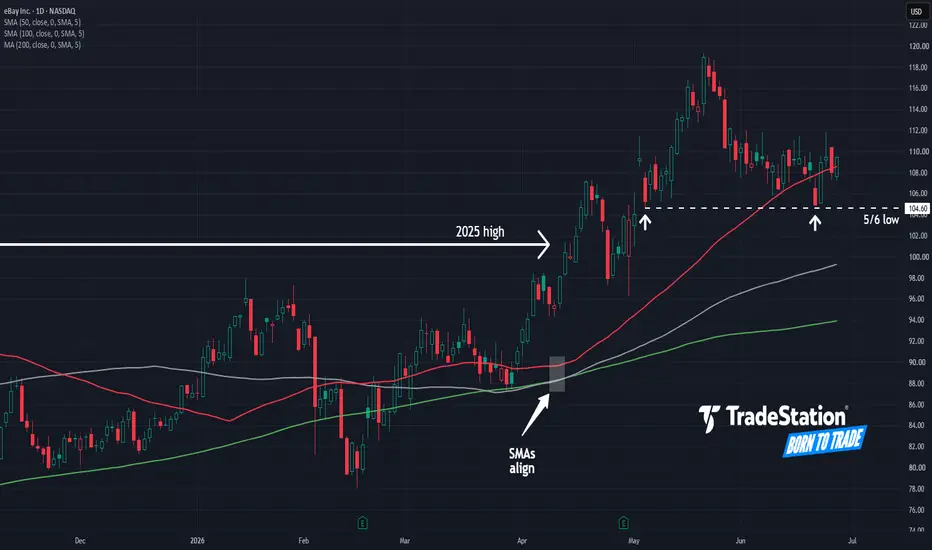
eBay Pulls Back Following SurgeeBay rallied to new record highs in April and May. Now some traders may see an opportunity as the e-commerce stock pulls back.
The first pattern on today’s chart is the 2025 high of $101.15. EBAY passed through that resistance and has stayed above it, which may be consistent with the initial stages of a breakout.
Second is the May 6 low of $104.60. Prices have remained above that level, including a bounce this week. Is new support in place above old peaks?
Third, the 50-day simple moving aver
Vertex Inc | VERX | Long at $11.25TECHNICAL ANALYSIS
The price for Vertex Inc NASDAQ:VERX touched my selected "crash" simple moving average area (green lines) a few days ago at $10.21. This could be an area of support given it's a newer play, but there is 50/50 risk of further decline into the bottom half of the channel (near $5). Thus, starter position only at $11.25.
INSIDERS
Recent buying between $12-$15: openinsider.com
GROWTH
High growth through 2029 .
FUNDAMENTALS
Have a look .
ACTION
Star
$LUV - 50 SMA Breakout on Growing Volume💡 Swing setup idea
The 50SMA strategy
🔎 Analysis summary:
The stock recently broke above key resistance and successfully pushed above the 50 SMA.
Growing buyers volume is stepping in, showing strong momentum behind the move.
🔔 Sector note: There is a recent upward move across the airlines sector as gas prices go down, giving this setup a nice tailwind.
👀 Levels to watch:
Entry trigger: Break above $43.90
Target: $52.07
Stop: Under the breakout level
💬 What do you think of this setup
HANGSENG LONG — 6H (WR 86%)Hang Seng 6H ALMA long adds filled on the 2026-06-05 cluster (~24,665–25,064). Averaging into a regional correction, not a breakout chase.
Positive factors
- Strong HANGSENG WR/PF in strategy database
- Multiple 6H/12H ENTRY same session — internal confluence
- ALMA averaging built for drawdown entries
Negative factors
- Asia risk-off can overshoot before exit
- Several 6H legs still ~flat to −1.5% MTM
- Bounce can fail; −10% hard stop per leg still active
XAUUSD — EMA Downtrend, Waiting for a Value Pullback
Fundamental Analysis
Gold remains under bearish pressure as price continues to trade below the main EMA structure. Traders are still watching USD momentum, Treasury yields, and upcoming U.S. macro data.
For now, any short-term recovery should be treated as a technical pullback unless price can reclaim the EMA resistance zone with strong confirmation.
Technical Analysis
On the 2H chart, XAUUSD is still trading below EMA 34, EMA 89, and EMA 200. This confirms that the main trend remains bear
$GOLD Back to $4k!! Death Cross Next to $3,600TVC:GOLD BACK TO $4k ‼️
Exactly what I predicted 1-month ago 🤓
There doesn’t appear to be much interest at this level as we’ve failed to see a volume breakout.
Note there is slight bullish divergence, but it’s not meaningful without a strong reaction from PA.
First step will be to reclaim the 9EMA.
There is a bullish wedge pattern that allows for further downside to $3,900 which lines up with prior support.
The 50/200 DMA Death Cross should occur within the next week which will be fuele