Day 63 of 90 — Bullish Recovery Into Compression🛡️ Day 63 of 90 — Bullish Recovery Into Compression
XAUUSD | M15 | Sentinel Core | Sentinel Structure | Sentinel Companion
Situation
• Price delivered strong bullish expansion after sweeping discount liquidity near 4,505
• Buyers reclaimed short-term EMA structure and continued building higher lows
• Market is now compressing beneath premium resistance around 4,570–4,578
👉 Bullish recovery remains active, but confirmation above resistance has not yet developed
What This Chart Shows
• Strong recovery momentum formed after downside liquidity was cleared from discount territory
• Multiple HL formations developed above EMA support during intraday rotation
• Current price action is consolidating below premium resistance while buyers continue defending structure near 4,552–4,558
👉 Compression beneath resistance is not automatic breakout confirmation
🟦 Phase 1 — Liquidity Sweep Into Discount
Price aggressively swept lower value:
• Liquidity sweep below 4,505 lows
• Emotional downside expansion into discount territory
👉 Buyers reacted aggressively after downside liquidity was cleared
🟩 Phase 2 — Bullish Recovery Rotation
Bullish momentum recovered strongly:
• 4,505 → 4,578 bullish recovery expansion
• EMA reclaim supported continuation structure above higher lows
👉 Buyers regained short-term control after protected HL formations developed
🟨 Phase 3 — Compression Beneath Premium Resistance
Price is now consolidating beneath resistance:
• Immediate resistance sits near 4,570–4,578
• Current support remains around 4,552–4,558
• Buyers continue defending HL structure above EMA support
👉 Compression beneath resistance can still become another LH if confirmation fails
Key Lesson
Not during emotional expansion
Not during sideways compression
Only after structure confirms continuation
Momentum alone is not confirmation.
Execution Note (Sentinel Core)
• Wait for protected HL continuation above 4,552–4,558 before considering longs
• Respect premium resistance near 4,570–4,578
• Structure first → confirmation second → execution last
🛡️ No confirmation = No trade
Sentinel Principle
You do not trade the move.
You trade confirmed structure.
🛡️ Patience > Excitement
Series Note
Building consistency through observation, not prediction.
#XAUUSD #Gold #PriceAction #MarketStructure #SentinelCore #Intraday #Scalping #TradingView  Short
Short
 Short
Short
S&P 500 Eyes 7600 After Bullish BreakoutWhile an end to the war may have been priced more times than I care to remember, with earnings growth topping forecasts across most sectors on the back of decent nominal economic growth and the AI infrastructure boom, a weaker US dollar starting to deliver tailwinds for offshore earners, and with technicals favouring upside, it’s hard to dislike the near-term outlook for US stocks.
With our S&P 500 contract breaking to fresh highs, a long setup may therefore be in order.
If we were to see a pullback and bounce from or near the former record high of 7517, longs could be established with a tight stop below, targeting higher levels. With the US, UK and Hong Kong markets offline for public holidays, it’s creating some caution about chasing at these levels, hence why I’d like to see a retest and bounce before entry.
As for targets, the index often gravitates towards big figures once it’s broken to fresh highs, making 7600 the first cab off the rank.
With RSI (14) pushing higher again and MACD on the cusp of delivering a bullish crossover, the momentum picture favours longs over shorts, as does the bullish price action and raft of medium and longer-term moving averages with a positive slope.
Good luck!
DS  Long
Long
 Long
Long
 Long
Long
 Long
Long
 Short
Short
 Short
Short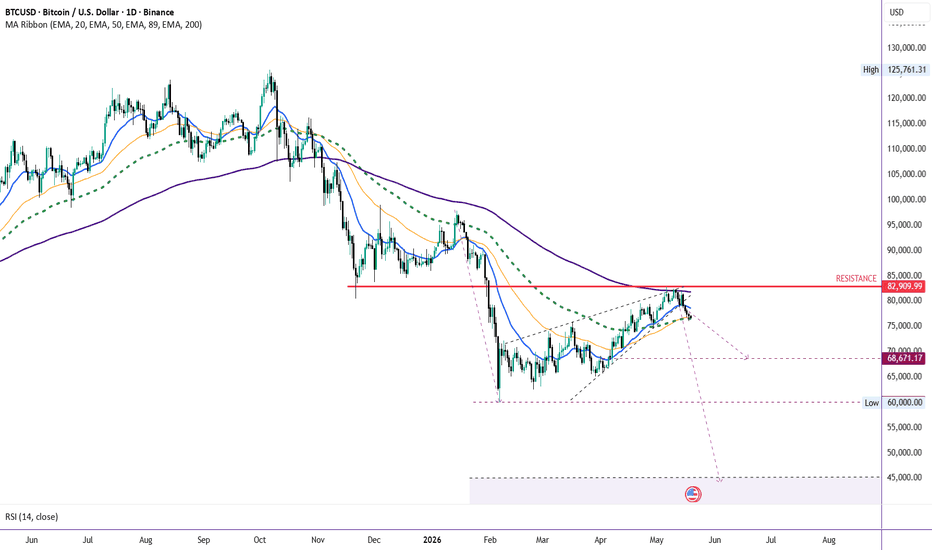
 Long
Long
 Short
Short
Long 
Short 
Applied Materials: Uptrend Intact?Applied Materials has climbed most of the year, and some traders may think its uptrend remains intact.
The first pattern on today’s chart is the bullish gap on April 8. The provider of chip equipment tested the low of that session three weeks later and held. This week it appears to have made a higher weekly low.
Prices have also remained mostly above the rising 50-day simple moving average.
Both signals may be consistent with an intermediate-term uptrend.
Next, Wilder’s Relative Strength Index (RSI) has stayed above its midpoint at 50. That can also reflect positive momentum.
Finally, the 8-day exponential moving average (EMA) has stayed above the 21-day EMA.
TradeStation has, for decades, advanced the trading industry, providing access to stocks, options and futures. If you're born to trade, we could be for you. Learn more here about TradingView’s Broker of the Year!
Past performance, whether actual or indicated by historical tests of strategies, is no guarantee of future performance or success. There is a possibility that you may sustain a loss equal to or greater than your entire investment regardless of which asset class you trade (equities, options or futures); therefore, you should not invest or risk money that you cannot afford to lose. Online trading is not suitable for all investors. View the document titled Characteristics and Risks of Standardized Options at www.TradeStation.com . Before trading any asset class, customers must read the relevant risk disclosure statements on www.TradeStation.com . System access and trade placement and execution may be delayed or fail due to market volatility and volume, quote delays, system and software errors, Internet traffic, outages and other factors.
Securities and futures trading is offered to self-directed customers by TradeStation Securities, Inc., a broker-dealer registered with the Securities and Exchange Commission and a futures commission merchant licensed with the Commodity Futures Trading Commission). TradeStation Securities is a member of the Financial Industry Regulatory Authority, the National Futures Association, and a number of exchanges.
TradeStation Securities, Inc. and TradeStation Technologies, Inc. are each wholly owned subsidiaries of TradeStation Group, Inc., both operating, and providing products and services, under the TradeStation brand and trademark. When applying for, or purchasing, accounts, subscriptions, products and services, it is important that you know which company you will be dealing with. Visit www.TradeStation.com for further important information explaining what this means. Short 
Aussie Jumps as Trade Relief Boosts Risk AppetiteAUD/USD rose by 0.6% on Wednesday, May 20 as the Australian Dollar benefited from a broad improvement in global risk sentiment tied to stabilizing trade relations between the United States, China, and the European Union. Markets responded positively to signs that tariff tensions may be easing and that supply-chain pressures tied to industrials, semiconductors, and commodities could stabilize in the months ahead. For Australia, whose economy remains deeply linked to Chinese demand and global trade flows, the shift supported commodity-sensitive currencies and helped drive renewed buying interest in the Aussie.
On the U.S. side, the greenback softened modestly as Treasury yields stabilized and investors rotated back toward higher-beta currencies following several weeks of defensive positioning. Australia’s domestic backdrop also remained relatively supportive, with markets continuing to price a cautious but steady Reserve Bank of Australia policy stance as inflation risks tied to energy and housing remain elevated. The result was a strong session for AUD/USD, driven less by domestic economic surprises and more by improving global macro sentiment and easing trade-related stress.
In the above chart, AUD/USD has found support at its 50-day exponential moving average (EMA), holding the broad uptrend that’s defined calendar year 2026 thus far. While base metal prices have subsided in recent days, as well as precious metals, the continued yield advantage held by the Australian Dollar thanks to the RBA’s hawkish bias are helping to reinforce the push to the upside. If the next leg higher is beginning, then the lows seen over the past few sessions around 0.7079 should hold. Failure to sustain prices above 0.7150, on the other hand, could open the pair to renewed weakness within the broader range of 0.6900 - 0.7100. 76K HOLDS — IS BTC READY FOR 82.5K?Hello friends! 🍀
Yesterday we discussed the following scenario:
“If we don’t see a move toward the upper boundary of the range at 78,000 in the near term, it would signal weak price action and could lead to a continuation of the correction toward the next marked level at 73,700❌”
Fortunately, we are now seeing movement toward 78,000, which means the 76,000 level has so far acted as solid support and managed to push the price higher.
We continue watching the next move closely, but keep in mind:
🚀 A breakout above 78,000 would most likely confirm continuation toward 82,500 and higher to the previously mentioned targets.
⚰️ A breakdown below 76,000, on the other hand, could open the way for a continuation of the decline toward 73,700.
Peace everyone 🌍
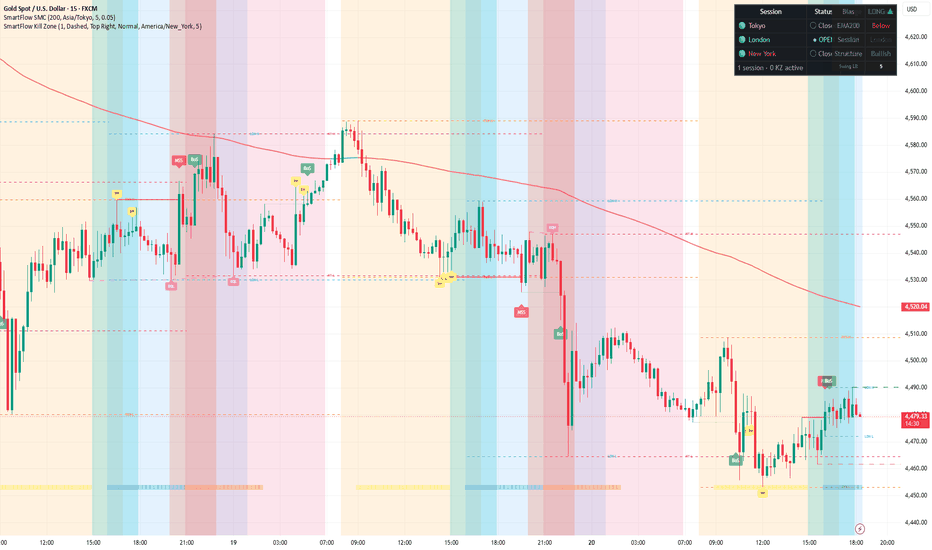
XAUUSD 15M — Aligned Bearish Deepens, $4,484 Below EMA200May 20 Cross-Asset SMC Read
Gold's bearish alignment continues to deepen. Since flipping to aligned SHORT on May 4, Gold has not looked back — dropping from $4,562 through $4,666 (May 11) and now to $4,484. That is nearly $80 of additional downside in nine days.
Price remains firmly below the EMA200 ($4,520), and the 15M structure shows a clean series of bearish BoS labels. The most recent session saw a drop to the $4,440 area before a modest bounce into London. No bullish structural shift in sight.
Signal: Below EMA200 + Bearish Structure = Aligned SHORT
Key Levels:
• Resistance: $4,520 (EMA200), $4,540–$4,550 (prior consolidation)
• Support: $4,460 (session low zone), $4,440 (swing low)
Context: Gold has maintained aligned SHORT status for three consecutive readings now — the longest sustained alignment this asset has shown in our 7+ week tracking window. The trend is clear until structure flips.  Short
Short