XAU/USD 09 July 2026 Intraday AnalysisH4 Analysis:
-> Swing: Bullish.
-> Internal: Bearish.
Bias and analysis to remain the same as analysis dated 30 June 2026.
Price did not print bullish CHoCH to indicate bullish pullback phase initiation. Price instead printed a new low followed by a bullish CHoCH
Price is currently trading within and established internal range, however, I will continue to monitor price with respect to depth of pullback.
Intraday expectation:
Price to trade up to either premium of internal 50% EQ, or H4 demand zone before targeting weak internal low, currently priced at 3,942.100.
Note:
Gold remains volatile as tensions between the US, Israel, and Iran keep safe‑haven demand elevated.
Markets are reacting quickly to every headline, while uncertainty around the Fed’s easing path and shifting U.S. policy under President Trump, especially tariffs continues to fuel choppy price action.
For newer traders, the key is simple, stay flexible and manage risk carefully, as fast spikes and sudden reversals are a normal part of the current XAU/USD environment.
H4 Chart:
M15 Analysis:
-> Swing: Bearish.
-> Internal: Bullish.
Analysis and bias remains the same as analysis dated 06 July 2026.
Price previously did not print a bearish CHoCH and continued bullish.
Price subsequently printed a bearish CHoCH to indicate bearish pullback phase initiation.
Price is currently trading within an established internal range, however, I shall monitor price with respect to depth of pullback.
Intraday expectation:
Price to trade down to either discount of internal 50% EQ, or M15 supply zone before targeting weak internal high, priced at 4,195.510. Price may potentially print higher to bring CHoCH positioning closer to recent price action
Note:
Gold remains highly reactive on M15 as geopolitical risk continues to drive quick, headline‑led moves.
The tension between the US, Israel, and Iran is keeping safe‑haven demand elevated, with markets still sensitive to any sign of escalation.
At the same time, shifting US tariff policy under President Trump is adding extra uncertainty, fuelling sharp intraday swings and increasing the likelihood of sudden sentiment flips. Liquidity pockets and whipsaws remain common, making disciplined risk management essential.
Gold’s geopolitical premium is still firmly in place, and until tensions ease, short‑term volatility is likely to stay front‑loaded.
M15 Chart:  Short
Short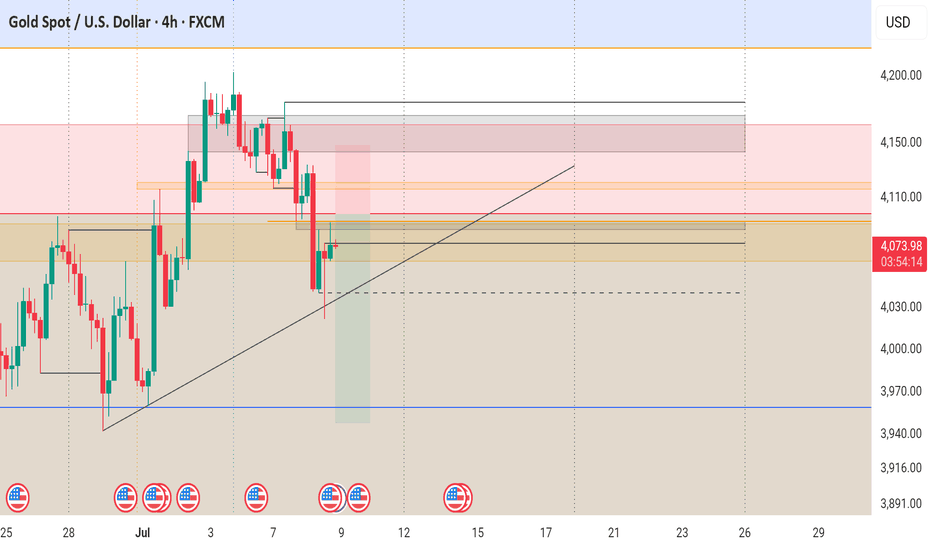
VWAGY | Volkswagen | Q3 2026 | Week ChartVolkswagen AG-
MARKET-BEATING SCORE 0/10
Dividend yield (indicated)
5.13%
----------------------------------
Positive EPS ($1.42)
EPS growth 7.82% — supports path to +25% rebalance target.
Conservative D/E (0.67) — balance sheet resilience.
Positive FCF — real cash generation. Best long-run predictor of value creation.
Volkswagen owns so many other automobile companies like Audi, Bugatti, Bently, Ducati, Lamborghini, Porsche, and some others.
----------------------------------
Multiple Time-Frame Analysis; Color Code | Strength favors the higher timeframe.
Yearly timeframe = black
Monthly timeframe = pink
weekly = grey
daily = red
4hr = orange
1hr = yellow
15min = blue
5min = green if they are shown. (Level visibility on intervals is set to timeframe the level was found on and below to keep chart view organized.)
** Candle Science explained **
A Range = two or more consecutive color candles.
There are two types of ranges - accumulation and distribution.
DISTRIBUTION RANGES DEFINED:
When price is above a distribution range, these candles/levels act as support.
(BS) BACKSIDE Candle - First distribution candle in a distribution range. Expectation = strong reaction to price. long wicks reaching to or away from level.
(FS) FrontSide Candle - Last distribution candle in a distribution range. Expectation = reversal, create a trend in the opposite direction. Distribution candles are used as support.
ACCUMULATION RANGES DEFINED: When price is below an accumulation range, these candles/levels act as resistance.
INVERSE BACKSIDE (Inv.BS) - First Accumulation candle in an accumulation range. Expectation. = strong reaction to price. long wicks reaching to or away from level.
INVERSE FRONTSIDE (Inv.FS) - Last accumulation candle in an accumulation range. Expectation = reversal, create a trend in the opposite direction. Accumulation candles are used as resistance. P911 | PORSCHE | Q3 2026 | Day ChartPorsche AG -
MARKET-BEATING SCORE -3/10
Dividend yield (indicated)
2.14%
----------------------------------
I posted a Ferrari chart last week. Then thought I could do a Porsche chart and since I'm doing a Porsche chart, I'll have to do a VWAGY chart since Volkswagen owns it and so many other automobile companies like Audi, Bugatti, Bently, Ducati, Lamborghini, Porsche, and some others.
----------------------------------
Multiple Time-Frame Analysis; Color Code | Strength favors the higher timeframe.
Yearly timeframe = black
Monthly timeframe = pink
weekly = grey
daily = red
4hr = orange
1hr = yellow
15min = blue
5min = green if they are shown. (Level visibility on intervals is set to timeframe the level was found on and below to keep chart view organized.)
** Candle Science explained **
A Range = two or more consecutive color candles.
There are two types of ranges - accumulation and distribution.
DISTRIBUTION RANGES DEFINED:
When price is above a distribution range, these candles/levels act as support.
(BS) BACKSIDE Candle - First distribution candle in a distribution range. Expectation = strong reaction to price. long wicks reaching to or away from level.
(FS) FrontSide Candle - Last distribution candle in a distribution range. Expectation = reversal, create a trend in the opposite direction. Distribution candles are used as support.
ACCUMULATION RANGES DEFINED: When price is below an accumulation range, these candles/levels act as resistance.
INVERSE BACKSIDE (Inv.BS) - First Accumulation candle in an accumulation range. Expectation. = strong reaction to price. long wicks reaching to or away from level.
INVERSE FRONTSIDE (Inv.FS) - Last accumulation candle in an accumulation range. Expectation = reversal, create a trend in the opposite direction. Accumulation candles are used as resistance. Wave (IV) May Be Preparing the Next Bullish CycleBitcoin Futures (BTC1!) – Daily Chart
Aggressive Scenario: Wave (IV) May Be Preparing the Next Bullish Cycle
Based on the current market structure, the preferred wave count is derived from the rules and guidelines of the Elliott Wave Principle.
The preferred interpretation suggests that the decline from the recent high is developing as Wave (IV) of a larger degree. At this stage, the correction is most likely unfolding as a Bigger Zigzag, with the market progressing through its internal a-b-c structure before Wave (IV) reaches completion.
As long as this wave count remains structurally consistent, the completion of Wave (IV) could provide the foundation for the next impulsive advance in Wave (V).
Based on the current wave structure and Fibonacci relationships, the initial objective would be the First Target Range, followed by the Target Range. If Wave (V) extends, the market could eventually reach the Expanded Target, completing another major impulsive sequence.
However, until Wave (IV) is confirmed as complete, every bullish objective should be viewed strictly as a structural scenario, rather than a price prediction. The ongoing corrective structure will determine whether Wave (IV) concludes as a relatively straightforward correction or evolves into a more complex pattern, such as a Multiple Zigzag or another valid corrective formation.
For this reason, the primary focus remains on monitoring the internal development of Wave (IV). Only after the correction is structurally complete can the probability of the next impulsive advance in Wave (V) be evaluated with greater confidence.
If the completion of Wave (IV) is confirmed, the larger bullish cycle is expected to resume. Under this scenario, Wave (V) could carry Bitcoin beyond its previous all-time high and establish a new historical high. The ultimate extent of Wave (V), however, will depend on the strength and quality of the impulsive structure emerging from the completion of Wave (IV).
This analysis presents a structural interpretation based on the Elliott Wave Principle and should not be considered a price prediction. The preferred wave count will be reassessed whenever market structure no longer supports the current interpretation.
— Mr. Nobody
Independent Elliott Wave Principle Researcher
"Patterns whisper. I listen." 📊🎧  Short
Short
Aggressive Scenario: Wave (IV) Remains the Preferred OutlookBitcoin (BTC/USD) – Weekly Chart
Aggressive Scenario: Wave (IV) Remains the Preferred Outlook
From a structural perspective, the current wave count remains valid based on the rules and guidelines of the Elliott Wave Principle.
The preferred interpretation is that Bitcoin is currently developing Wave (IV) of a larger degree. At this stage, the most probable corrective structure remains either a Simple Zigzag or, should the correction become more complex, a Multiple Zigzag.
Based on the current structure, the $30,000–$40,000 region continues to represent the preferred target zone for the completion of Wave (IV).
However, if the correction extends into a larger and more complex structure, Wave (IV) could eventually retrace toward the price territory of Wave (4) of Wave (5), located near $15,000. At the present time, there is insufficient structural evidence to favor such an extended correction.
According to the Elliott Wave Principle, the probability of a deeper retracement can only be evaluated after at least three waves of the corrective structure have been completed. Until then, the internal structure of the correction should continue to guide the preferred wave count.
Therefore, the primary expectation remains the completion of Wave (IV) as either a Simple Zigzag or a Multiple Zigzag, with the $30,000–$40,000 region serving as the preferred target. Any assessment of a deeper decline toward the territory of Wave (4) of Wave (5) will depend on how the corrective structure develops in the coming months.
This analysis presents a structural interpretation based on the Elliott Wave Principle and should not be considered a price prediction. The wave count remains valid as long as market structure continues to support it. Any violation of Elliott Wave rules or structural changes may require a revised wave count.
— Mr. Nobody
Independent Elliott Wave Principle Researcher
"Patterns whisper. I listen." 📊🎧 Short 
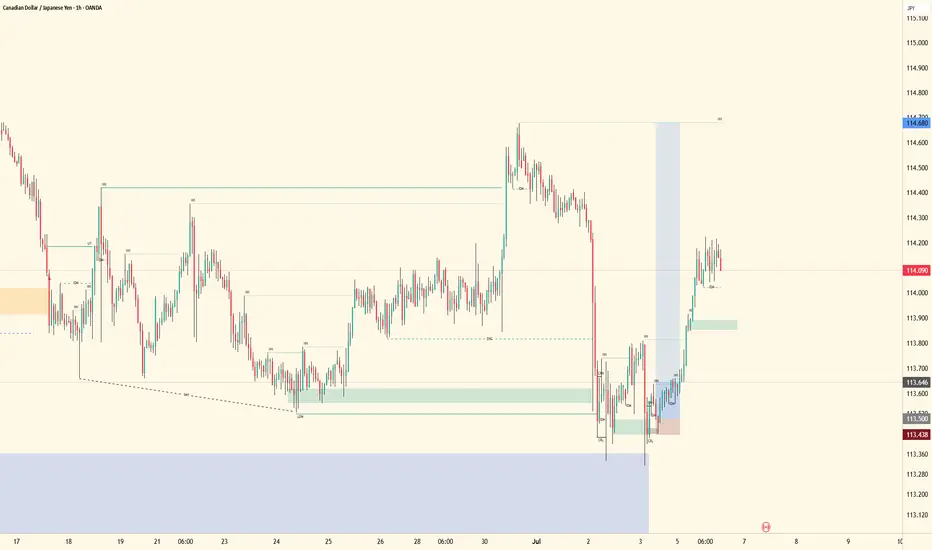
CADJPY - Higher Time Frame Bullish ContinuationThe higher time frame remains bullish, confirmed through top-down structure analysis.
Price has already broken key higher time frame levels, creating a displacement away from prior highs. From there, mid-term liquidity was taken as price engineered internal inducement and delivered into the last Point of Interest within the range, reacting within the auction area.
This move also swept higher time frame inducement levels and mitigated the higher time frame bullish order block (primarily through wick reaction rather than full acceptance). This suggests liquidity was taken, but bullish intent remains intact.
From a mid-term perspective, price has now shown lower time frame trend change. Minor structural breaks have occurred, forming a new high and shifting momentum back in favor of buyers.
On the lower time frame, price continued to engineer liquidity within the bullish leg, rebalance inefficiencies, and mitigate the most recent auction zone within the green range. The lows delivered a clean sweep, aligning with the liquidity model and supporting the bullish continuation thesis.
From here, price is now targeting lower time frame highs. If those levels are taken, I will continue to follow momentum in line with the existing higher time frame trend.
If price invalidates this structure, I will reassess based on the next liquidity event and re-map accordingly. No bias—only reaction to data.
Overall target remains unchanged: higher time frame and mid-term highs.
Patience is key. Track structure, follow liquidity, and let price confirm continuation before expansion.
Simple Zigzag Toward the Completion of the Corrective CycleBitcoin (BTC/USD) – Daily Chart
Aggressive Scenario: Simple Zigzag Toward the Completion of the Corrective Cycle
The aggressive scenario continues to favor the development of a Simple Zigzag (A-B-C) correction. If this structure unfolds as expected, Bitcoin could decline toward the $40,000 region before the larger corrective cycle reaches completion.
As illustrated on the chart, Wave A has already completed as a clear five-wave impulse, satisfying one of the defining characteristics of a Zigzag correction. Following that decline, Wave B developed as a Classic Zigzag, and the most recent selloff is currently interpreted as Wave (1) of Wave C.
If this wave count remains valid, the current advance is expected to unfold as Wave (2) in the form of any valid three-wave corrective structure. Once that correction is complete, the market could resume its decline in Wave (3), followed by a corrective Wave (4) before a final decline in Wave (5) completes Wave C and, consequently, the entire Simple Zigzag correction.
Under this scenario, the completion of the correction would also mark the end of the current eight-wave Elliott Wave cycle, potentially paving the way for the beginning of a new impulsive cycle. If confirmed, this new cycle could carry Bitcoin beyond its previous all-time high and establish a new historical high.
However, if the current rally extends beyond the expected corrective structure, there remains the possibility that the correction evolves into a Triple Zigzag. While this alternative still belongs to the aggressive outlook, the Simple Zigzag currently remains the preferred scenario, as it provides the most direct interpretation while remaining fully consistent with the present wave structure.
This analysis presents a structural Elliott Wave scenario, not a price prediction. The wave count remains valid as long as the Elliott Wave Principle and the current market structure continue to support it. Should the structure change, the wave count will be revised accordingly.
— Mr. Nobody
Independent Elliott Wave Principle Researcher
"Patterns whisper. I listen." 📊🎧
Bitcoin
Feb 5
Bitcoin Daily – Wave I Completed, Corrective Phase in Progress
Bitcoin
Feb 5
Bitcoin 4H – Final Leg of the Bearish Impulse (Wave 5 of 5)
Bitcoin
4 days ago
Bitcoin 4H | Is the First Bearish Leg Complete.
Short 
Long 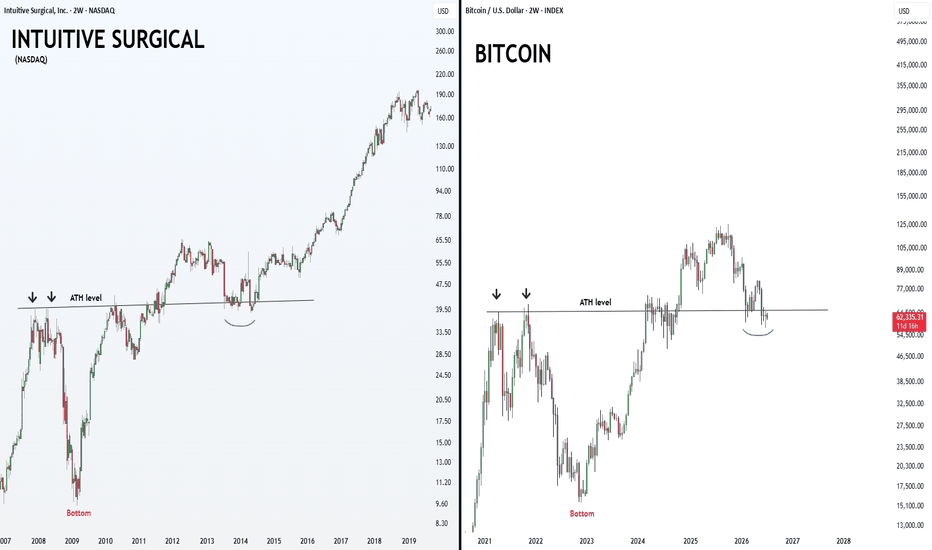
Short 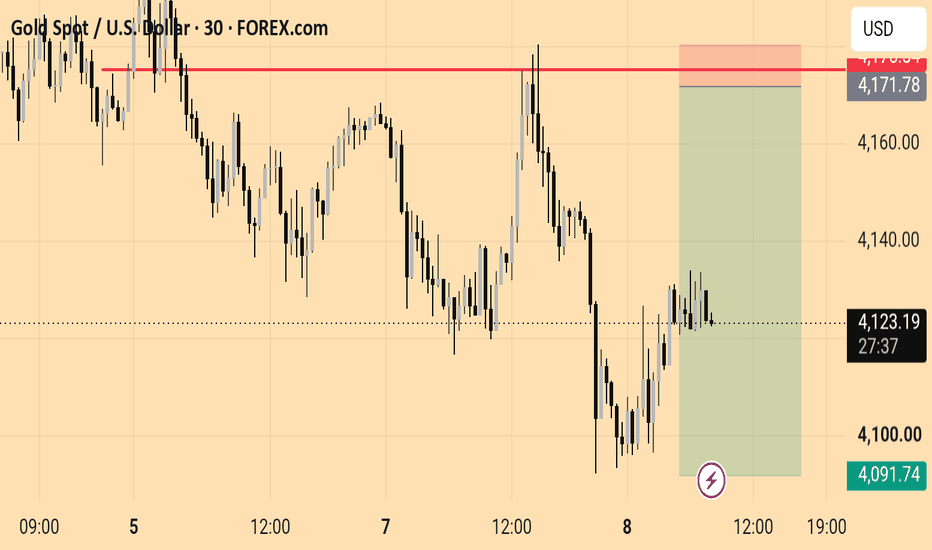
XAU/USD 08 July 2026 Intraday AnalysisH4 Analysis:
-> Swing: Bullish.
-> Internal: Bearish.
Bias and analysis to remain the same as analysis dated 30 June 2026.
Price did not print bullish CHoCH to indicate bullish pullback phase initiation. Price instead printed a new low followed by a bullish CHoCH
Price is currently trading within and established internal range, however, I will continue to monitor price with respect to depth of pullback.
Intraday expectation:
Price to trade up to either premium of internal 50% EQ, or H4 demand zone before targeting weak internal low, currently priced at 3,942.100.
Note:
Gold remains volatile as tensions between the US, Israel, and Iran keep safe‑haven demand elevated.
Markets are reacting quickly to every headline, while uncertainty around the Fed’s easing path and shifting U.S. policy under President Trump, especially tariffs continues to fuel choppy price action.
For newer traders, the key is simple, stay flexible and manage risk carefully, as fast spikes and sudden reversals are a normal part of the current XAU/USD environment.
H4 Chart:
M15 Analysis:
-> Swing: Bearish.
-> Internal: Bullish.
Analysis and bias remains the same as analysis dated 06 July 2026.
Price previously did not print a bearish CHoCH and continued bullish.
Price subsequently printed a bearish CHoCH to indicate bearish pullback phase initiation.
Price is currently trading within an established internal range, however, I shall monitor price with respect to depth of pullback.
Intraday expectation:
Price to trade down to either discount of internal 50% EQ, or M15 supply zone before targeting weak internal high, priced at 4,195.510. Price may potentially print higher to bring CHoCH positioning closer to recent price action
Note:
Gold remains highly reactive on M15 as geopolitical risk continues to drive quick, headline‑led moves.
The tension between the US, Israel, and Iran is keeping safe‑haven demand elevated, with markets still sensitive to any sign of escalation.
At the same time, shifting US tariff policy under President Trump is adding extra uncertainty, fuelling sharp intraday swings and increasing the likelihood of sudden sentiment flips. Liquidity pockets and whipsaws remain common, making disciplined risk management essential.
Gold’s geopolitical premium is still firmly in place, and until tensions ease, short‑term volatility is likely to stay front‑loaded.
M15 Chart: AUDCAD | Walking Through My Trade Process: From Bias To EntryFirst video breakdown, so the quality and delivery won’t be perfect, but the goal is to show the process and give a walkthrough of how I’m approaching this setup.
In this breakdown, I’m showing how I go from higher timeframe analysis down into lower timeframe confirmation and what I’m looking for before taking an entry.
Starting with the bigger picture, AUDCAD is showing bullish structure with price continuing to respect higher highs and higher lows. From there, I’m tracking how price interacts with key liquidity areas, inducement levels, and potential accumulation zones.
As price developed, we saw liquidity being taken, engineered, and eventually a return back into the area of interest. After mitigation and confirmation, I waited for lower timeframe structure to shift before looking for continuation.
The focus was not on forcing a trade, but allowing price to build the story:
● liquidity being created and taken
● structure shifting
● order flow being respected
● displacement confirming intent
This video is simply a walkthrough of my thought process and the steps I’m looking for before entering a position.
Still improving the videos and delivery over time, but the mission stays the same:
Patience is key. Tracking remains the edge. 📈
Long 
 Long
Long
 Short
Short