Short
Short
How Will Gold React After the FOMC Decision?XAUUSD Technical Analysis (H1)
Based on the chart, price is recovering from a key support zone and has formed a Higher Low structure. However, it remains under pressure from the long-term descending trendline. The market is now approaching the confluence of the trendline and a key resistance zone, which is likely to determine the short-term direction.
Trend
* Short-term: Neutral with a bullish bias.
* Price continues to hold above the 4,049 – 4,015 support zone, suggesting that buying momentum is gradually strengthening.
* A confirmed breakout and H1/H4 candle close above the descending trendline is required to validate a bullish trend continuation.
Resistance Levels
🔵 4,085 – 4,092 – Immediate resistance, aligned with the descending trendline.
🔵 4,111 – The next resistance level if the breakout is confirmed.
🔵 4,135 – Major resistance and the target of the next bullish leg.
Support Levels
🟢 4,049 – Immediate support, acting as the retest zone following the recent recovery.
🟢 4,015 – Strong support and the base of the current Higher Low structure.
⸻
Trading Scenarios
📈 Bullish Scenario: Price holds above 4,049, then breaks through the 4,085 – 4,092 resistance zone and confirms the breakout with an H1/H4 candle close. The next upside targets are 4,111 and 4,135.
📉 Bearish Scenario: If price is rejected at the descending trendline and falls below 4,049, it may retreat to test 4,015. A break below this support would signal the return of bearish pressure.
⸻
Trading Plan
🟢 BUY GOLD
* Entry: 4,015 – 4,017
* Stop Loss: 4,005
* Take Profit: 200 / 500 / 1000 pips
🔴 SELL GOLD
* Entry: 4,092 – 4,094
* Stop Loss: 4,104
* Take Profit: 200 / 500 / 1000 pips
Risk Management
* Risk no more than 1–2% of your account equity per trade.
* Wait for a confirmed breakout or rejection signal before entering any position.
* Consider moving your Stop Loss to breakeven once the trade reaches a reasonable profit level to protect your capital and reduce risk. Long 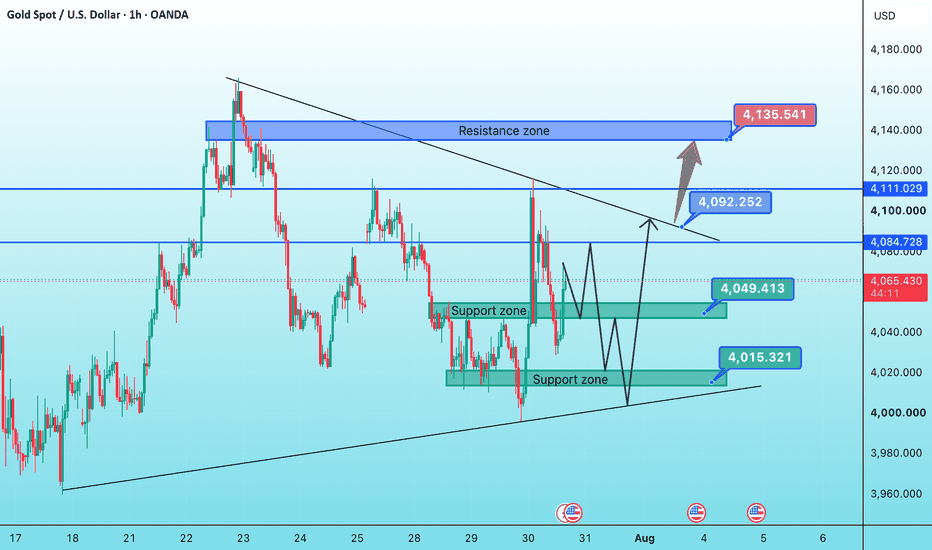
 Short
Short
GOLD - Ahead of the Fed meeting. Bearish trendICMARKETS:XAUUSD is rebounding from the 4000 level but remains trapped within the 4010–4050 trading range. At the same time, the U.S. Dollar Index has entered a consolidation phase as markets await the upcoming Federal Reserve meeting
Gold is trading cautiously ahead of the Fed decision amid renewed geopolitical tensions. The key catalyst will be the Fed's guidance on the future path of interest rates. Any hint of a dovish shift could fuel a rally in gold, while a hawkish message would likely restore downside pressure.
Bullish drivers: Dovish Fed rhetoric, A weaker U.S. dollar, Lower rate expectations, Geopolitical de-escalation
Bearish drivers: Hawkish Fed guidance (persistent inflation concerns, hints of further tightening, a more hawkish voting balance), Escalation of geopolitical tensions, supporting both the U.S. dollar and oil prices
Resistance levels: 4070, 4083, 4116
Support levels: 4011, 3983
Fundamentally, there are reasons to expect the Federal Reserve to maintain a hawkish tone. From a technical perspective, gold remains under pressure within a broader bearish trend. As a result, the upcoming news-driven volatility could trigger a retest of the 4070–4083 resistance zone—or even 4116—before the downtrend resumes toward the 4000–3950 area.
Best regards,
R. Linda Short 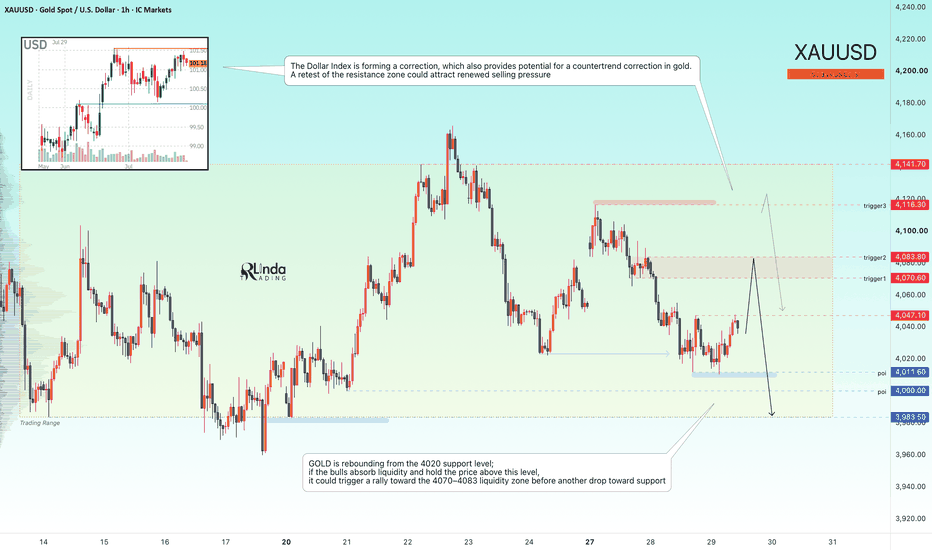
GOLD: 4,075 Trap Before FOMC Flush?
Fundamental & Sentiment Analysis
Gold (XAUUSD) has executed a clean technical bounce off the $4,020 liquidity floor, staging an aggressive relief recovery on the M30 intraday grid. However, this upward push occurs directly in the shadow of tonight’s high-impact Federal Reserve (FOMC) interest rate decision and Chair Warsh’s monetary policy conference.
The current intraday rally is driven by pre-FOMC short-covering and algorithmic liquidity rebalancing. Smart money desks are driving price upward to mitigate imbalances and hunt resting buy-stop liquidity into overhead supply zones before tonight's macro volatility arrives.
Key Technical Levels
Our M30 market structure illustrates a high-probability supply mitigation setup ahead of the news:
Primary Supply Rejection Zone (Grey Box): 4,068.000 – 4,075.000 – The key overhead resistance confluence and broken structure flip. This is the primed execution window for institutional sellers to step back in.
Target Downside Support Floor: 4,035.000 – 4,040.000 – The immediate demand zone and structural target for the projected bearish rejection leg.
Macro Invalidation Ceiling: 4,115.000 – Clear overhead level marking complete structural invalidation.
Market Debate
Will the ongoing rally get violently rejected at the 4,068 - 4,075 grey box to trigger a pre-FOMC drop to $4,035, or can bulls squeeze straight to $4,100?
The Bearish Case (Sellers): The M30 bounce is merely a textbook liquidity trap designed to induce retail FOMO buying right into overhead supply. Once the 4,068 - 4,075 grey box absorbs buy orders, institutional algorithms will deliver a swift downside expansion toward the 4,035 support floor.
The Bullish Case (Buyers): The break above the descending trendline confirms a structural shift. If buyers manage to sustain a clean M30 candle close above 4,075, the bearish narrative dissolves, paving the path for a continuous rally toward 4,100+.
💬 What is your trade strategy ahead of tonight's FOMC decision? Shorting the 4,075 supply box or waiting for the news? Short 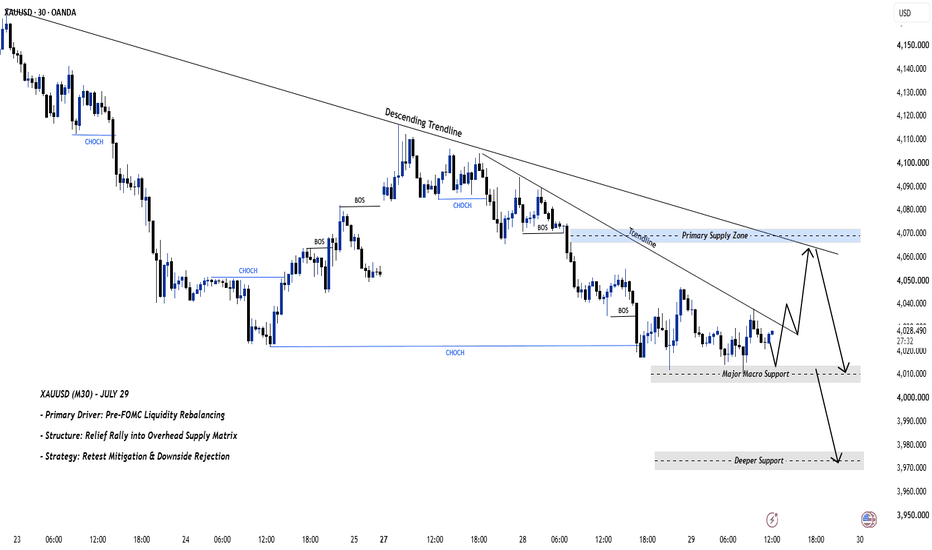
Gold Remains in Consolidation as Markets Await the FOMC DecisionXAUUSD Technical Analysis (H1)
Based on the chart, price remains in a short-term bearish trend, consistently forming Lower Highs and Lower Lows while continuing to trade below the descending trendline. Price is currently consolidating just below the nearest resistance zone, suggesting that sellers remain in control, although the market is still trapped in a consolidation phase.
Trend
* Short-term: Bearish
* Price remains below the descending trendline and beneath the 4,045 – 4,052 supply zone.
* Only a clear H1/H4 candle close above this area, accompanied by a breakout of the descending trendline, would confirm a potential bullish reversal.
Resistance Levels
🔵 4,045 – 4,052 – Immediate resistance and a key retest area of the descending trendline.
🔵 4,080 – 4,087 – Major resistance and the next upside target if a successful breakout occurs.
Support Levels
🟢 4,000 – 4,001 – Key psychological support level.
🟢 3,970 – 3,974 – Strong support zone where buying interest may emerge if price continues to weaken.
⸻
Trading Scenarios
📈 Bullish Scenario: Price breaks above the 4,045 – 4,052 resistance zone, successfully retests it, and holds above the descending trendline. If confirmed, the next upside target will be 4,080 – 4,087.
📉 Bearish Scenario: If price is rejected at the 4,045 – 4,052 resistance zone and breaks below 4,000, the downtrend is likely to continue toward 3,970 – 3,974.
⸻
Trading Plan
🟢 BUY GOLD
* Entry: 4,000 – 4,002
* Stop Loss: 3,990 (assuming “4990” was intended to be 3990; if not, please adjust accordingly)
* Take Profit: 200 / 500 / 1000 pips
🔴 SELL GOLD
* Entry: 4,086 – 4,088
* Stop Loss: 4,098
* Take Profit: 200 / 500 / 1000 pips
Risk Management
* Risk no more than 1–2% of your account equity per trade.
* Wait for confirmation before entering any position.
* Consider moving your Stop Loss to breakeven once the trade reaches a reasonable profit level to protect your capital and reduce risk. Short 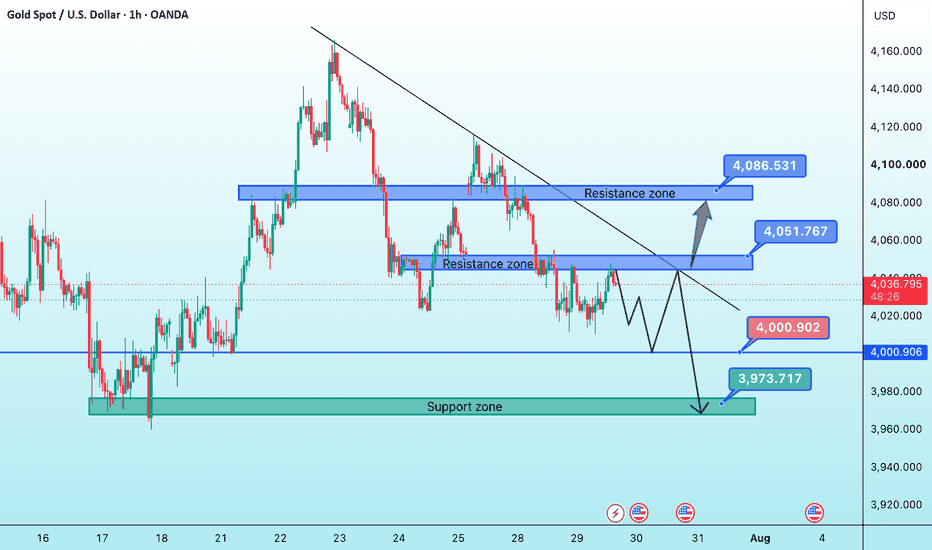
XAUUSD: Bullish Recovery Builds Inside the Channel
Gold is showing a stronger recovery reaction after defending the lower support area inside the descending channel. From Kelly’s view, the market is still not fully bullish on the bigger structure, but the short-term Elliott wave is improving and may continue higher if buyers can hold the current support zone.
The key idea is simple: gold is recovering from support, but the next move needs confirmation above the resistance-buy zone.
⟡ Market structure
The chart shows gold has been trading inside a descending channel, with sellers controlling the broader direction. However, price reacted well from the strong support zone around 4,020–4,030, showing that buyers are trying to build a short-term recovery base.
Current price is reacting near 4,045–4,060, which is marked as the resistance-buy zone. This area is very important because if price holds above it, the zone may change from resistance into support.
If buyers defend this area, gold may continue towards the 4,090–4,100 zone, where the chart marks the possible Elliott completion area.
➤ Key levels
◌ 4,020–4,030: strong support and recovery base
◌ 4,045–4,060: resistance-buy zone and current reaction area
◌ 4,070: short-term upside checkpoint
◌ 4,090–4,100: Elliott completion / main target zone
◌ 4,150: higher extension area if momentum expands
◌ Below 4,020: area where the bullish recovery setup weakens
⌁ Elliott Wave view
From an Elliott Wave perspective, gold may be forming a short-term bullish 5-wave recovery after the previous bearish move slowed down near support.
Wave 1 started from the lower support base.
Wave 2 corrected but did not break the recent low.
Wave 3 is now pushing price back towards the upper part of the channel.
Wave 4 may appear as a small pullback around the 4,045–4,060 zone.
If this zone holds, wave 5 may continue towards 4,090–4,100.
This is why Kelly would not chase price blindly. The cleaner setup is to wait for the market to confirm that the current resistance-buy zone can hold as support.
▸ Trading scenario
Preferred scenario: wait for gold to hold above the 4,045–4,060 zone and show bullish confirmation.
Entry zone: 4,045–4,060 if bullish confirmation appears
Stop loss: below 4,020 or below the confirmed pullback low
Take profit 1: 4,070
Take profit 2: 4,090–4,100
Take profit 3: 4,150 if price breaks the channel with strength
Alternative scenario: if gold breaks below 4,020 with strong bearish pressure, the recovery setup weakens. In that case, price may return to the lower channel area before forming a new structure.
⌁ Kelly’s view
For Kelly, this is a bullish recovery setup inside a larger corrective channel. The short-term structure is improving, but buyers still need to prove strength above the current resistance-buy zone.
The best plan is to watch the reaction around 4,045–4,060. If this area holds, the next Elliott wave may continue towards 4,090–4,100.
Gold is recovering from support.
If buyers defend the current zone, wave 5 may continue higher.
Share your view below.
Long 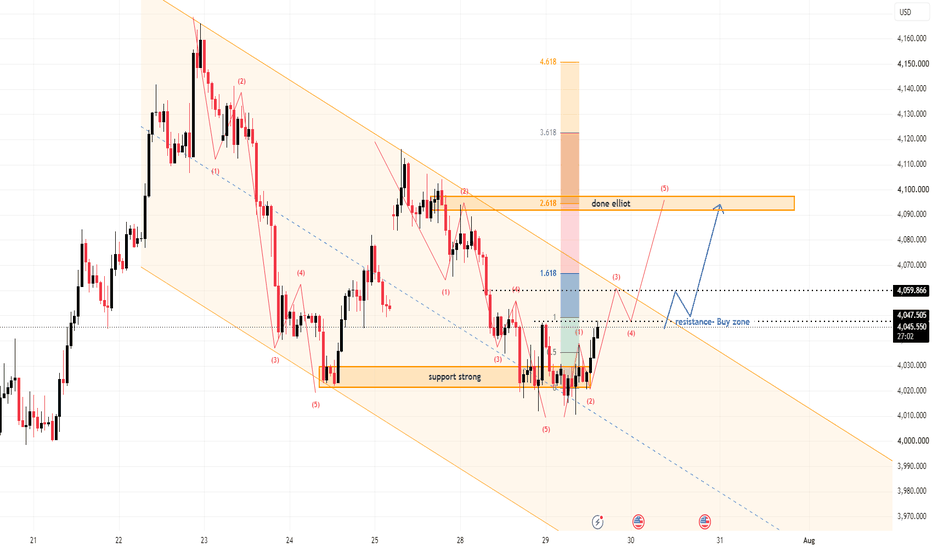
BRIAN XAUUSD – GOLD SITS ON VALUE SUPPORT BEFORE FED VOLATILITY BRIAN XAUUSD – GOLD SITS ON VALUE SUPPORT BEFORE FED VOLATILITY
Gold is still trading under pressure as oil prices rebound after the US intercepted Iranian missiles, keeping Middle East tension and inflation risk alive.
The dollar remains supported because traders are still pricing the possibility of more Fed tightening, with September rate-hike expectations staying elevated. That makes the current gold recovery fragile.
But the chart is now sitting at an interesting location.
Gold is not in premium anymore. Price has already dropped into the lower value area, and the next reaction around support will decide whether this becomes a short-term rebound or another breakdown.
Technical structure
On the H1 chart, gold has been moving lower after failing from the upper value structure.
Price rejected from the POC Retest Zone around 4,075 - 4,080 and is now trading near the VAL Support Zone around 4,020 - 4,025.
This is the key battlefield.
If buyers defend this zone, gold can attempt a recovery towards the POC Reclaim Line around 4,050. But if price fails to reclaim 4,050, the bounce may stay weak and sellers can return from value resistance.
The larger pressure remains bearish while gold trades below the VAH Sell Zone around 4,105 - 4,112.
Important zones
VAL Support Zone: 4,020 - 4,025
Current decision zone and lower value support.
POC Reclaim Line: 4,050
Key level buyers need to reclaim to confirm a stronger rebound.
POC Retest Zone: 4,075 - 4,080
Next resistance if price recovers.
VAH Sell Zone: 4,105 - 4,112
Major upper resistance where sellers may defend again.
Highest peak last week: 4,160 - 4,165
Upper liquidity reference if momentum changes completely.
Trading scenario
Buy reaction from VAL Support Zone 4,020 - 4,025
Entry:
Look for buy positions only if price holds 4,020 - 4,025 and shows clear bullish rejection.
Stop Loss:
Below the VAL Support Zone or below the local sweep low.
Take Profit:
TP1: 4,050
TP2: 4,075 - 4,080
TP3: 4,105 - 4,112 only if buyers reclaim value strongly
This setup is based on a reaction from lower value. It is not a full bullish reversal yet. The real confirmation comes only if gold breaks and holds above 4,050.
Final view
Gold is still under macro pressure from USD strength, Fed uncertainty, and inflation risk.
But technically, price is now sitting at a value support area where a short-term rebound can appear.
For me, the key is simple:
Hold 4,020 - 4,025, gold can rebound towards 4,050.
Fail to reclaim 4,050, sellers may return.
Break below VAL support, the bearish auction continues.
This is not a place for emotional trading.
Let the Fed volatility come. Let price show acceptance. Then trade the reaction.
Value decides the next move.
Long 
 Long
Long
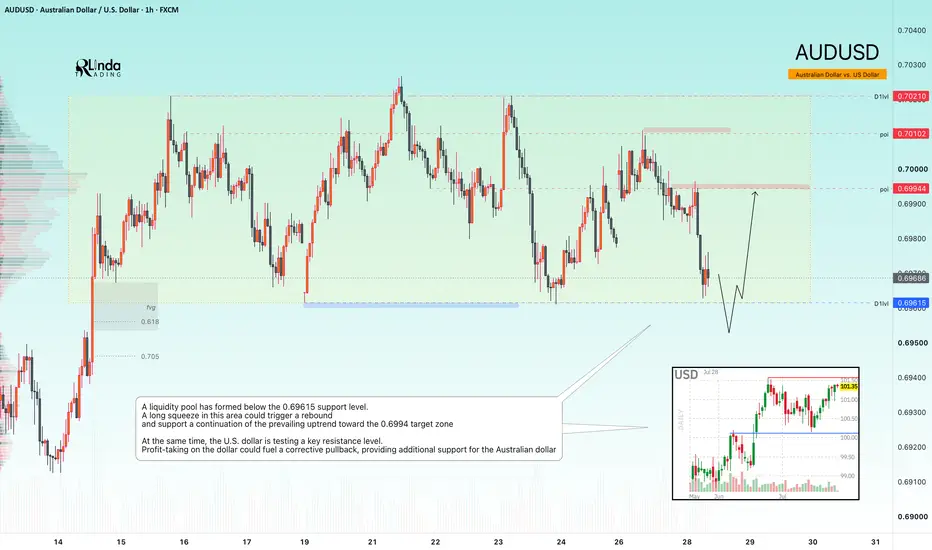
AUDUSD - A long squeeze could trigger a rally FX:AUDUSD is testing a key support zone, with a significant liquidity pool positioned just below it. The broader daily trend remains bullish, giving buyers an opportunity to regain control
At the same time, the U.S. Dollar Index is testing resistance. Profit-taking near the 101.5 area could trigger a pullback in the dollar, providing additional support for the Australian dollar.
From a technical perspective, a substantial liquidity pool has formed below 0.69615. A long squeeze in this area could trigger a rebound and support a continuation of the prevailing uptrend toward the next target zone
Resistance levels: 0.6994, 0.7010, 0.7021
Support level: 0.6960
A false breakout below 0.69615, followed by a recovery and sustained consolidation above this level, could become the technical catalyst for a rally toward 0.6994–0.7020
Best regards,
R. Linda How Will Gold Perform Ahead of the Interest Rate Decision?Market Outlook
Based on the chart, price has broken below the descending trendline. However, the breakout lacks strong momentum, and price is currently consolidating just above a key support zone. This suggests that the market still requires further confirmation before establishing its next directional trend.
Trend
* Short-term: Neutral with a bearish bias.
* Price remains below the major resistance zone at 4,086 – 4,088, indicating that sellers still hold the upper hand.
* A confirmed H1/H4 candle close above this zone is required to validate a bullish trend reversal.
Resistance Levels
🔵 4,086 – 4,088 – Primary resistance, aligned with the descending trendline and a previous supply zone.
* If price successfully breaks above and retests this area, the next upside targets are 4,104 – 4,115.
Support Levels
🟢 4,020 – 4,024 – Immediate support, which will likely determine the short-term direction.
🟢 4,000 – 4,001 – A key psychological support level. A confirmed break below this area could trigger a move back toward the 3,97x region.
🟢 3,970 – 3,973 – The final major support level if selling pressure continues to increase.
⸻
Trading Plan
🟢 BUY GOLD
* Entry: 3,974 – 3,972
* Stop Loss: 3,962
* Take Profit: 200 / 500 / 1000 pips
🔴 SELL GOLD
* Entry: 4,086 – 4,088
* Stop Loss: 4,098
* Take Profit: 200 / 500 / 1000 pips
Risk Management
* Risk no more than 1–2% of your account equity per trade.
* Wait for a confirmed breakout or rejection before entering any position.
* Consider moving your Stop Loss to breakeven once the trade reaches a reasonable profit level to protect your capital and reduce risk. Short 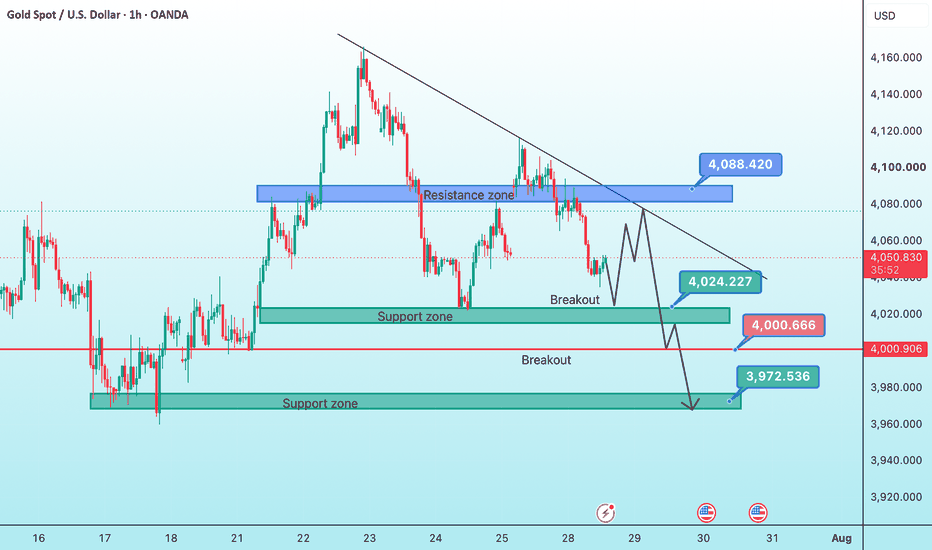
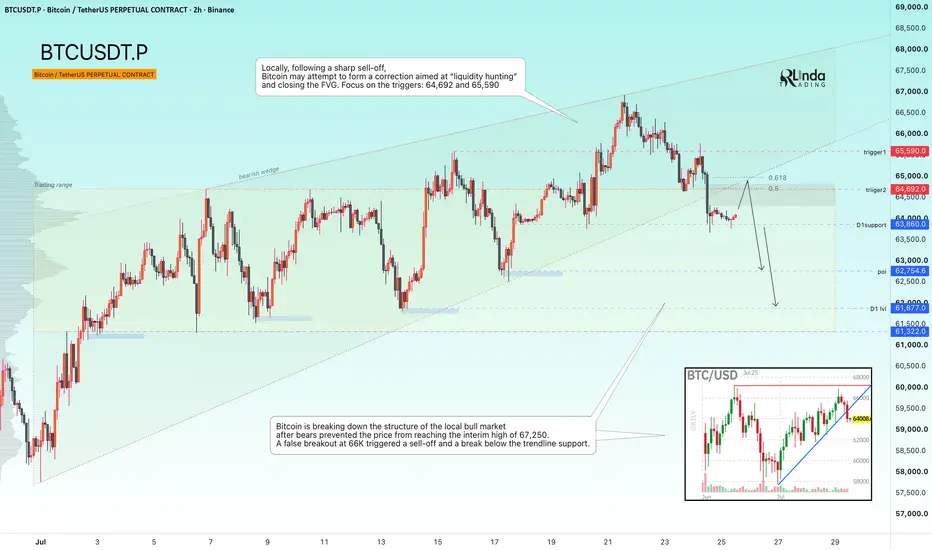
BITCOIN - A countertrend correction before a decline BINANCE:BTCUSDT.P is breaking the local bullish market structure within a broader bearish distribution phase while also forming a false breakdown below the 63,680 support area. The market continues to reinforce the dominance of the higher-timeframe bearish trend, although a corrective rebound remains possible before the next leg lower
Higher timeframe: The broader bearish trend remains intact. Sellers prevented price from reaching the key technical retracement level at 67,250, while a weak fundamental backdrop and continued ETF outflows continue to weigh on market sentiment.
From a technical perspective, Bitcoin has invalidated the local bullish structure after bears rejected the advance toward 67,250. The false breakout above 66K triggered a sharp sell-off and was followed by a break below the ascending trendline support
Resistance levels: 64,692, 65,590
Support levels: 63,860, 62,750, 61,322
Following the recent decline, Bitcoin may attempt a countertrend correction to sweep liquidity and fill the existing fair value gap. The primary focus remains on the 64,692 and 65,590 resistance levels. A short squeeze into this resistance zone could provide the technical setup for another bearish reversal toward the lower boundary of the current trading range
Best regards,
R. Linda  Short
Short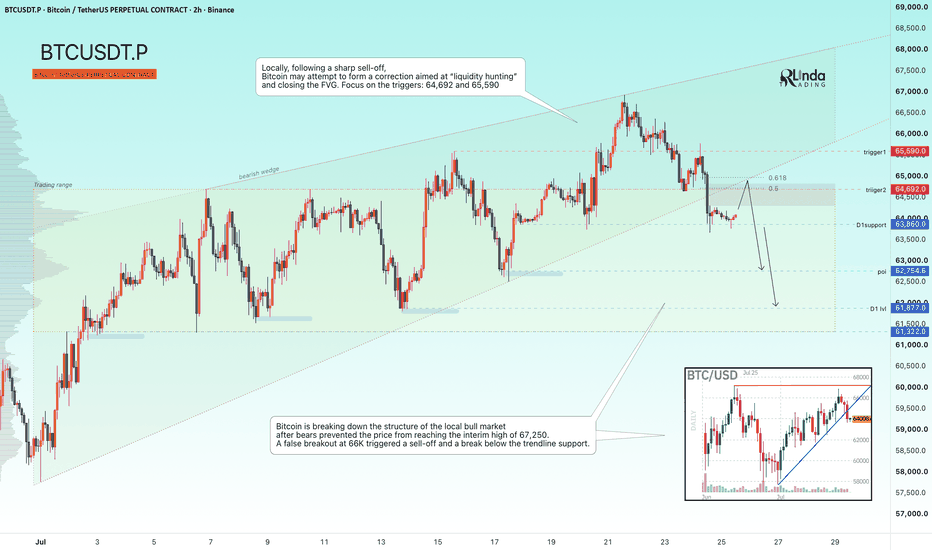
XAUUSD: ABC Pullback May Restart Wave 5
Gold is correcting after a short-term bullish recovery, but the structure has not turned bearish yet. From Kelly’s view, the current pullback may simply be an ABC correction before price attempts another upside leg towards the wave 5 completion zone.
The key idea is simple: gold may need one more clean support reaction before the next bullish continuation becomes stronger.
⟡ Market structure
The chart shows gold rejected from the upper area after completing a short recovery sequence. Price then pulled back sharply and is now reacting around 4,049, close to the marked Buy zone ABC.
This area is important because it may become the base for the next bullish leg if buyers defend it. The market is currently sitting between support and short-term resistance, so confirmation is more important than chasing price.
The nearest reaction zone above is around 4,065–4,070, marked as the sell scalping area. If gold breaks through this zone and holds, the bullish recovery may continue towards 4,090–4,095, where the chart marks the End wave 5 area.
➤ Key levels
◌ 4,040–4,050: Buy zone ABC and current support area
◌ 4,049: current price reaction area
◌ 4,065–4,070: sell scalping / short-term resistance
◌ 4,090–4,095: End wave 5 target zone
◌ Below 4,035: area where the bullish correction setup weakens
◌ Above 4,070: stronger confirmation for bullish continuation
⌁ Elliott Wave view
From an Elliott Wave perspective, gold appears to be forming an ABC correction after the previous upside recovery.
Wave A created the first pullback from the short-term high.
Wave B reacted upward but failed to continue strongly.
Wave C is now testing the lower buy zone around 4,040–4,050.
If wave C ends in this zone and buyers create a confirmation candle, gold may begin the next bullish phase. That next move can develop as wave 5, with the first target around 4,065–4,070 and the main target near 4,090–4,095.
▸ Trading scenario
Preferred scenario: wait for gold to hold the Buy zone ABC and show bullish confirmation.
Entry zone: 4,040–4,050 if bullish confirmation appears
Stop loss: below the confirmed wave C low or below 4,035
Take profit 1: 4,065–4,070
Take profit 2: 4,090–4,095
Take profit 3: higher only if price breaks the wave 5 zone with strong momentum
Alternative scenario: if gold breaks below 4,035 with strong bearish pressure, the ABC bullish setup weakens. In that case, price may need to form a deeper support base before the next recovery becomes reliable.
⌁ Kelly’s view
For Kelly, this is a bullish correction setup, not a chase-buy setup. Gold is still holding near the ABC support zone, but buyers need to confirm that this area is protected.
The cleanest plan is to wait for a reaction around 4,040–4,050. If this zone holds, gold may continue the next wave higher towards 4,090–4,095.
Gold is correcting inside a bullish structure.
If the ABC buy zone holds, wave 5 may continue upward.
Share your view below.
Long 
 Short
Short
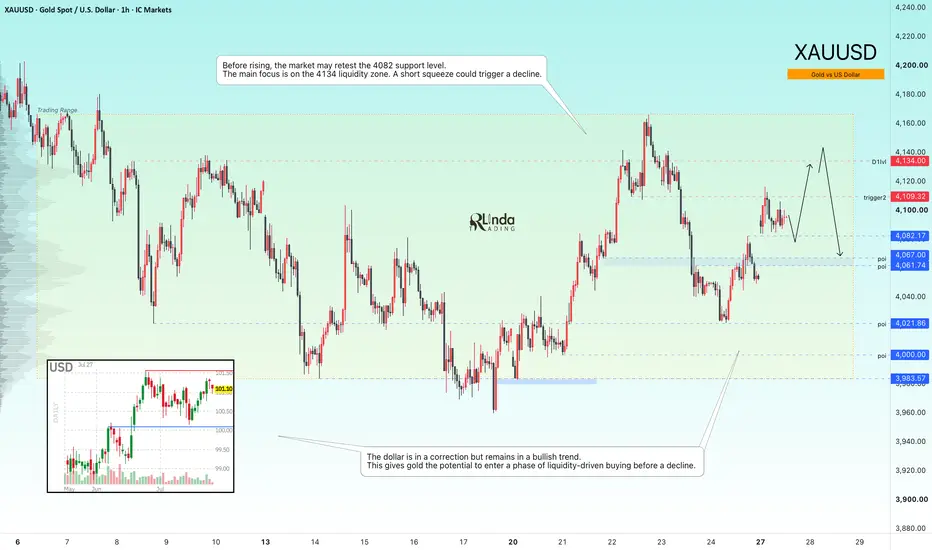
GOLD - Correction Before a Decline ICMARKETS:XAUUSD remains under pressure from the broader bearish trend. However, within this primary direction, the market is developing a sideways range and a countertrend correction. A stronger U.S. dollar could once again weigh on the metal
Gold has received temporary support from the recent geopolitical pause and a softer U.S. dollar. However, the sustainability of the recovery remains uncertain as markets await the upcoming Federal Reserve decision and further developments in the Middle East. Technical indicators continue to point to a bearish bias, limiting buyers' appetite.
Bullish drivers: Further U.S. dollar weakness, Geopolitical de-escalation, Lower oil prices and bond yields, A dovish signal from the Federal Reserve
Bearish drivers: Renewed geopolitical escalation, Rising oil prices, Hawkish Fed rhetoric, Renewed U.S. dollar strength
Resistance levels: 4109, 4134
Support levels: 4082, 4067, 4028
Although the U.S. dollar is currently in a corrective phase, its broader trend remains bullish. This could allow gold to complete a liquidity sweep before resuming its decline.
Before any further advance, gold may retest the 4082 support level. The primary focus remains on the 4134 liquidity zone, where a short squeeze could trigger another bearish reversal
Best regards,
R. Linda Short 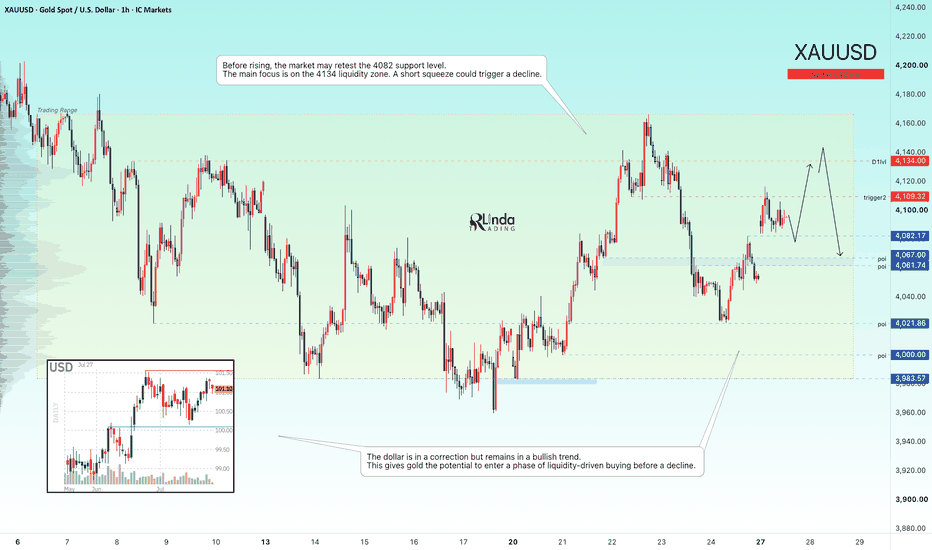
XAUUSD: Bullish Wave 5 May Continue From 4,084
Gold is still holding a constructive bullish structure after the strong recovery from the lower base. From Kelly’s view, the current chart suggests that XAUUSD may be preparing for another upside leg, with wave 5 potentially developing if the 4,079–4,084 buy zone continues to hold.
The key idea is simple: gold may correct first, but the main intraday structure still favours bullish continuation while price remains above the rising support line.
⟡ Market structure
The chart shows gold completed a strong recovery from the 4,020 area and formed a clean sequence of higher lows. After pushing into the 4,116 resistance area, price started to pull back, which looks like a healthy correction rather than a full bearish reversal.
Current price is around 4,085, directly near the buy zone wave 5 at 4,079–4,084. This is the key reaction area for buyers. If gold holds this zone and prints bullish confirmation, the next upside leg may continue towards 4,116 first, then 4,140–4,150.
The upper area around 4,140–4,150 is marked as the end wave 5 sell zone, while 4,165 remains the larger resistance and upside confirmation level.
➤ Key levels
◌ 4,079–4,084: buy zone wave 5 and key support
◌ 4,085: current price reaction area
◌ 4,116: first resistance and wave 3 high
◌ 4,140–4,150: end wave 5 / sell reaction zone
◌ 4,165: major resistance and bullish extension level
◌ Below 4,050: area where the bullish setup starts to weaken
⌁ Elliott Wave view
From an Elliott Wave perspective, gold appears to be forming a bullish 5-wave structure after the previous correction ended.
Wave 1 created the first upside reaction from the lower zone.
Wave 2 pulled back but held above the base.
Wave 3 expanded higher and reached the 4,116 area.
Wave 4 may now be forming as a controlled correction into 4,079–4,084.
If this zone holds, wave 5 may continue towards 4,140–4,150, with a possible extension towards 4,165 if momentum remains strong.
This is why Kelly would not chase price at resistance. The cleaner setup is to wait for price to respect the buy zone, then follow the next bullish confirmation.
▸ Trading scenario
Preferred scenario: wait for gold to hold the 4,079–4,084 buy zone and show bullish confirmation.
Entry zone: 4,079–4,084 if bullish confirmation appears
Stop loss: below the confirmed wave 4 low or below 4,050
Take profit 1: 4,116
Take profit 2: 4,140–4,150
Take profit 3: 4,165
Alternative scenario: if gold breaks below 4,079 and loses the rising trendline with strong bearish pressure, the bullish wave 5 setup weakens. In that case, price may retest the lower support around 4,050–4,020 before building a new structure.
⌁ Kelly’s view
For Kelly, the main structure still favours bullish continuation. Gold has built a clear recovery rhythm, and the current pullback may simply be wave 4 preparing the next wave 5 move.
The best plan is patience: wait for the buy zone reaction, then confirm whether buyers are still defending the trend.
Gold is correcting inside a bullish Elliott structure.
If 4,079–4,084 holds, wave 5 may continue towards 4,140–4,165.
Share your view below.
Long 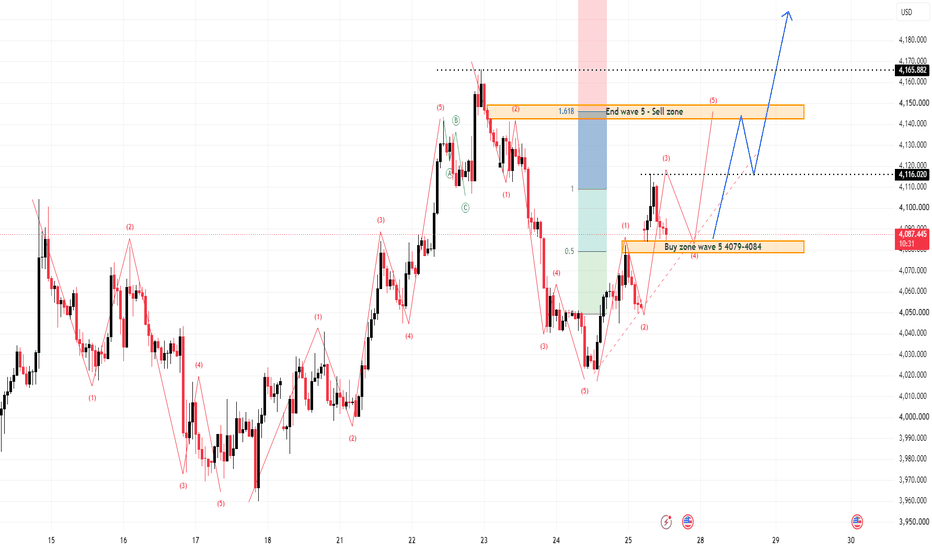
XAUUSD Buy-Side Liquidity Taken, Sellers Target Lower LiquidityGold (XAUUSD) on the 1-hour timeframe is showing a potential bearish continuation setup after rejecting from the weak high liquidity area around 4,165. Price created a bullish expansion earlier, but after collecting buy-side liquidity, the market formed a CHoCH (Change of Character) indicating a possible shift in short-term order flow.
Currently, price is retracing toward the marked Selling Zone / Supply Area, where institutional sellers may defend their positions and push price toward lower liquidity.
Technical Analysis:
Price swept liquidity near the weak high before showing rejection.
A bearish CHoCH confirmed the shift from bullish momentum to seller control.
Current price is approaching the Selling Zone around 4,090–4,100.
The recent bearish BOS confirms downside pressure.
Key support/liquidity target remains around 4,023 and 3,960 strong low area.
Bearish Scenario:
If price rejects the selling zone:
Target 1: 4,023 (previous liquidity level)
Target 2: 4,000 psychological level
Target 3: 3,960 Strong Low liquidity zone
Invalidation:
A strong breakout and acceptance above the selling zone can invalidate the bearish setup and may lead to another move toward the weak high.
SMC Logic:
Market sequence:
Buy-Side Liquidity Sweep → CHoCH → Bearish BOS → Retracement Into Supply → Sell-Side Liquidity Hunt
The current structure suggests that smart money may be targeting lower liquidity after collecting highs.
Fundamental Overview:
Gold remains sensitive to:
US Dollar strength
Federal Reserve interest rate expectations
Inflation data
Global risk sentiment and safe-haven demand
A stronger USD can pressure Gold lower, while USD weakness may support recovery.
Conclusion:
XAUUSD is currently reacting from a premium area after liquidity collection. If sellers maintain control from the selling zone, the next institutional objective remains the downside liquidity around 4,023–3,960.
Note:
Market collected buy-side liquidity near the weak high, then shifted structure with CHoCH. The current selling zone is the key area to watch for continuation toward lower liquidity. Short 
 Long
Long
GOLD - The Hunt for Liquidity (Correction) Before the Drop ICMARKETS:XAUUSD is recovering after Thursday's sharp decline, trading around $4,060 on Friday. This rebound may represent nothing more than a liquidity-building move before the broader downtrend resumes
The U.S. dollar continues to strengthen, while gold remains under selling pressure, reinforcing the prevailing bearish market structure. The broader trend remains firmly bearish.
From a technical perspective, gold continues to face pressure from geopolitical uncertainty and hawkish Federal Reserve expectations. The current recovery appears to be a countertrend correction toward key liquidity zones, potentially building momentum for another decline toward the 4000–3983 support area. The next directional move will largely depend on the U.S. dollar, oil prices, PMI data, and developments surrounding the geopolitical conflict.
Bearish drivers: Stronger hawkish Fed expectations, Rising oil prices, Continued U.S. dollar strength, Profit-taking, Bearish technical structure
Bullish drivers: U.S. dollar weakness triggered by new tariff developments, Geopolitical de-escalation, Weaker-than-expected PMI data
Resistance levels: 4061, 4067, 4109
Support levels: 4021, 4000, 3983
Within the current countertrend correction, gold is testing the first trigger zone at 4061–4067. A short squeeze around this area could trigger another reversal and send price back toward support. However, a deeper correction toward the 4109–4134 liquidity zone before the next bearish leg cannot be ruled out
Best regards,
R. Linda Short 
XAUUSD: Final Wave 5 May Prepare an ABC Recovery
Gold is still trading inside a larger bearish structure, with price staying below the major descending trendline. From Kelly’s view, the current weekly chart suggests that gold may still be moving inside wave 5, but the market is also approaching an important area where a corrective ABC recovery could form later.
The key idea is simple: gold may continue lower first, then prepare for an ABC rebound if wave 5 completes around the lower Fibonacci buy zone.
⟡ Market structure
The chart shows gold has been under pressure since the major high, with each recovery attempt forming lower highs under the downtrend trendline. The broader structure is still bearish because price has not broken back above the descending resistance.
Gold is currently trading around 4,052 after consolidating above the 3,963 support area. The nearest resistance is the 4,090–4,120 sell zone. If price fails to reclaim this area, sellers may continue to control the weekly structure.
The lower target area is around 3,720–3,760, where the chart marks the 2.618 Fibonacci extension and the possible end of wave 5. This is the zone Kelly will watch carefully for a potential exhaustion reaction.
➤ Key levels
◌ 3,963: current support and short-term reaction level
◌ 4,052: current price area
◌ 4,090–4,120: sell zone and weekly resistance
◌ 4,380–4,420: end wave C / higher recovery target
◌ 3,720–3,760: end wave 5 / Fibonacci 2.618 buy zone
◌ Above 4,420: area where the larger bearish structure weakens
⌁ Elliott Wave view
From an Elliott Wave perspective, gold appears to be developing the final part of a larger bearish 5-wave cycle.
Wave 1 started the first major drop from the upper zone.
Wave 2 corrected higher but failed below the downtrend line.
Wave 3 created the strongest decline.
Wave 4 formed a sideways recovery near the sell zone.
Wave 5 may now continue lower towards the 3,720–3,760 Fibonacci completion area.
If wave 5 completes around this zone and price creates a strong bullish reaction, gold may then begin an ABC recovery into late next week. In that case, wave A could rebound towards 4,090–4,120, wave B may retest support, and wave C could extend towards the higher 4,380–4,420 resistance zone.
▸ Trading scenario
Preferred scenario: wait for price to retest resistance and show bearish confirmation before expecting wave 5 continuation.
Sell zone: 4,090–4,120 if rejection appears
Stop loss: above the confirmed rejection high or above 4,150
Take profit 1: 3,963
Take profit 2: 3,850
Take profit 3: 3,720–3,760
Recovery scenario: if gold reaches 3,720–3,760 and forms bullish confirmation, Kelly will watch for an ABC rebound setup.
Buy zone: 3,720–3,760 only after clear bullish reaction
Stop loss: below the confirmed wave 5 low
Take profit 1: 3,963
Take profit 2: 4,090–4,120
Take profit 3: 4,380–4,420 if wave C expands
Alternative scenario: if gold breaks above 4,120 and holds strongly, the wave 5 bearish continuation may weaken. In that case, price could start the ABC recovery earlier than expected.
⌁ Kelly’s view
For Kelly, the weekly structure is still bearish while gold remains under the downtrend trendline and below the sell zone. However, the market is getting closer to a possible wave 5 exhaustion area.
The cleanest plan is to follow the bearish structure first, then watch for reaction at the Fibonacci completion zone.
Gold may still need one more downside leg.
If wave 5 completes near the lower buy zone, an ABC recovery could appear later next week.
Share your view below. Short 
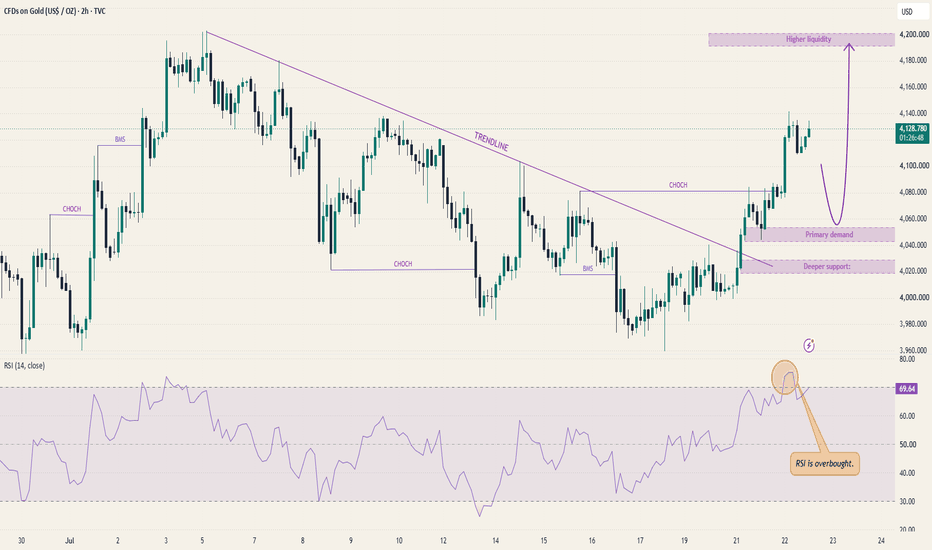
XAUUSD — Bullish Retest AheadGold remains sensitive to the US dollar, Treasury yields and interest-rate expectations. Softer yields or renewed USD weakness could support the bullish structure, while stronger US data may trigger a temporary correction.
Technical View
On the H2 chart, XAUUSD has broken above the descending trendline and confirmed a bullish CHOCH around 4,080. The strong displacement toward 4,130–4,140 shows that buyers currently control the short-term structure.
However, RSI is trading near 70, suggesting that price may be temporarily extended. I would prefer to see a controlled retracement before considering further bullish continuation.
Key Levels
Immediate resistance: 4,135–4,145
Primary demand: 4,040–4,055
Deeper support: 4,018–4,030
Higher liquidity: 4,190–4,200
Trading Scenario
My bias remains bullish while price holds above the broken trendline and the 4,018–4,055 demand area.
A pullback into 4,040–4,055, followed by bullish confirmation, could support another expansion toward 4,190–4,200. A deeper retracement into 4,018–4,030 may still preserve the bullish structure, but a decisive break below this region would weaken the scenario.
Overall View
The trendline breakout and bullish CHOCH support further upside, but the overbought RSI suggests patience may be needed before the next expansion.
Do you expect XAUUSD to retest demand first or continue directly toward 4,200? Long