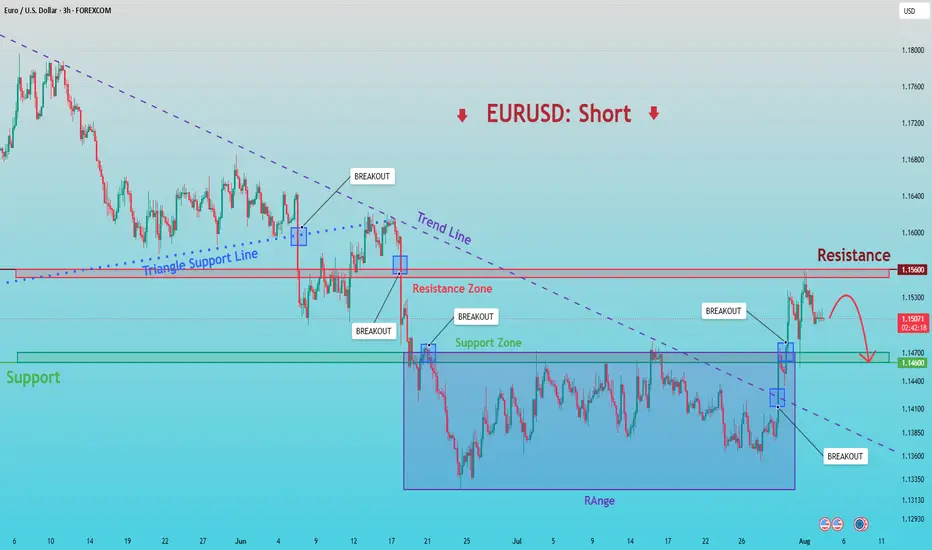
EURUSD: Fails at 1.1560 — Bears Aim for 1.1460Hello everyone, here is my breakdown of the current EURUSD setup.
Market Analysis
EURUSD recently rallied after breaking above the long-term descending trendline, but the advance stalled at the 1.1560 Resistance Zone, where sellers stepped back into the market. The latest rejection from resistance suggests bullish momentum is fading, while price remains vulnerable to a pullback.
Currently, EURUSD is trading below the 1.1560 Resistance Zone while holding above the 1.1460 Support Zone. Price i
Triangle
XAUUSD Triangle Support Holds, Recovery Toward $4,100Hello traders! Here’s my technical outlook based on the current XAUUSD (2H) chart structure. XAUUSD previously declined inside a bearish channel before finding support and reversing higher. After the recovery, price formed an ascending triangle, with buyers consistently defending the 4,020 Buyer Zone while sellers continue protecting the 4,100 Seller Zone and the descending resistance line. Currently, XAUUSD is trading above the 4,020 Buyer Zone while remaining below the 4,100 Seller Zone and th
GOLD - A short squeeze could lead to a correction ICMARKETS:XAUUSD is advancing during the Asian session as part of a distribution phase, testing the 4166–4195 resistance zone. The move is being driven by Western comments regarding negotiations in the Middle East. However, Iran has yet to respond, leaving geopolitical uncertainty elevated.
The U.S. dollar remains in consolidation following last week's decline, which was largely triggered by intervention in the Japanese yen. Gold showed little reaction to the weaker dollar and continued tr
Platinum: Cup-and-Handle breakout, WPIC deficit;trade setup!The platinum trade appears to be the least recognized asset in the precious metals complex at this time and today's chart may have just delivered the technical confirmation that has been brewing within the markets for months now. Even though the focus from investors all year long has been on the gold and silver trades, the platinum market has been quietly developing its own structural bull thesis that takes into account the generational supply crunch, the AI demand tailwind that has not yet been
NZDUSD - Ready for growth within the trend Following a strong rally, FX:NZDUSD is now retesting the former resistance of its trading range, which has turned into support. This creates an opportunity for the bullish trend to continue.
The U.S. Dollar Index has broken its recent market structure, and continued dollar weakness could provide additional support for the pair
From a technical perspective, NZDUSD is performing a classic support retest within its countertrend recovery, while buyers are actively defending the 0.5863 level.
EURJPY - Long squeeze on support amid a bullish trend FX:EURJPY has fallen sharply following the Bank of Japan's intervention, triggering a long squeeze below key support. A recovery back into the trading range could provide the foundation for a bullish rebound
The market is currently stabilizing after the sharp decline, with price testing what was previously the daily range support, now acting as resistance.
A move back above the 180.80 level, followed by sustained consolidation, would confirm the recent breakdown as a false breakout and could t
Gold at a Critical $4,000 Support: Rebound or Breakdown?Gold ( OANDA:XAUUSD ) is currently trading near the Heavy Support Zone, the key trading level of $4,030, the Potential Reversal Zone(PRZ), and the psychological level of $4,000.
On the 4-hour time frame, the Symmetrical Triangle remains the most important technical structure to monitor.
Can gold hold above $4,000 and begin a recovery, or is another bearish breakdown approaching?
Technical Analysis
Gold appears to have been moving inside a Descending Channel over the past 12–13 days.
From an
Gold Inside a Triangle - This Is NOT the Time for Big RiskIn my previous analysis , I mentioned that Gold had likely completed its medium-term bearish wave and entered a sideways phase.
The key levels remained $3950 as major support and $4180 as major resistance, while I preferred waiting for liquidity to be collected below support before looking for higher-timeframe long opportunities.
The market has now evolved.
A relatively clear symmetrical triangle is forming on the 4H chart.
It's important to understand that I am not trading because of th
Solana tightens inside a triangle: breakout or breakdown?Solana tightens inside a triangle: breakout or breakdown?
SOL trades near $73.17, holding above the SMA 200 at $73.05 but below the EMA 9 at $73.40 and SMA 50 at $73.34. MACD is bearish as price approaches the triangle’s apex.
▫️ Solana’s on-chain activity increased year over year
▫️ Network costs declined
▫️ Liquid staking usage expanded
▫️ Q2 annualized staking yield was approximately 6.25%
The fundamentals are improving, but the news has not produced immediate demand for SOL.
🧠 Smart Mome
Hindustan Zinc Ltd. – Ascending Triangle DevelopingHindustan Zinc is showing signs of strength after finding support near the rising trendline of a developing Ascending Triangle. The stock has been making higher lows, while the broader descending resistance continues to cap the upside, bringing price closer to a decisive breakout point.
With volatility compressing and buyers defending higher levels, the setup is becoming increasingly attractive for a potential bullish expansion.
Trading Plan:
✅ Bullish on a sustained breakout above ₹560–₹565
US10Y- The Most Important Chart Is Sending a Warning for StocksThe most important chart in the market right now is the US 10-Year Treasury Yield.
And the chart looks BULLISH. Extremely BULLISH. Which is a problem. A BIG problem for stocks, especially growth stocks and the Nasdaq in particular.
The US10Y yield is the market’s benchmark risk-free rate, representing the return investors can earn by lending money to the US government for 10 years. Because almost every asset is priced relative to this rate, a rise in the 10-Year yield increases the discount ra
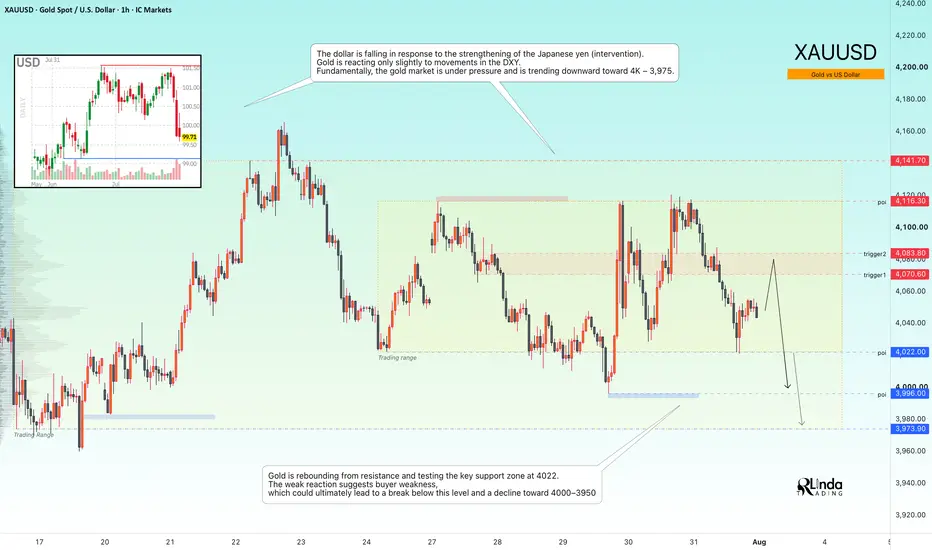
GOLD - Consolidation Amid a Bearish Trend ICMARKETS:XAUUSD remains trapped within the 4022–4116 trading range as markets await the next major economic catalysts. From a technical perspective, however, the broader bearish trend continues to dominate
The U.S. dollar has weakened following renewed strength in the Japanese yen, driven by intervention efforts. Despite this, gold has shown only a muted response to the decline in the DXY. Fundamentally, the metal remains under pressure, with the market still favoring a move toward the 40
XAUUSD: Sellers Defend Trendline as 4,000 Becomes Next TargetHello everyone, here is my breakdown of the current XAUUSD setup.
Market Analysis
XAUUSD previously traded below a long-term descending trendline before breaking beneath triangle support, confirming bearish momentum. After the decline, price entered a broad consolidation range and later formed a descending channel. Although buyers managed to break above the channel, the recovery stalled near the 4,120 Resistance Zone, where a false breakout signaled renewed selling pressure.
Currently, XAUUS
Bearish Ascending Triangle pattern for TRXUSDT on Dailywe can see that clearly on Chart that TRXUSDT forming a clear bearish ascending triangle on Basic Chart Pattern Theories.
Lookin for entry if you notice that TRX forming a weak candle, we can sell on weakness. As always use proper money management and Trade Wisely guys. Happy Profit :)
Gold in a Symmetrical Triangle — Which Way Will It Break?Gold ( OANDA:XAUUSD ) has been trading inside a Symmetrical Triangle over the past three days, and a breakout from either trendline could determine its broader direction over the coming weeks.
The price is currently testing the Resistance Zone and the upper trendline of the Descending Channel.
Can gold break higher, or is another move below $4,000 approaching?
Technical Analysis
From an Elliott Wave perspective, gold appears to be completing a Zigzag Correction.
A Negative Regular Divergenc
GOLD - The bearish trend continuesICMARKETS:XAUUSD remains in a medium-term bearish trend. The recent attempt to break above 4116 failed, and the market has once again transitioned into a selling phase
Gold is currently caught between geopolitical tensions, which tend to strengthen the U.S. dollar, and expectations surrounding upcoming central bank decisions. The next directional move will largely depend on developments in the Middle East and signals from the Bank of Japan. A continued hawkish stance from the Federal Reserve
GBPJPY Breakdown: Is a Deeper Correction Beginning?GBPJPY ( OANDA:GBPJPY ) started to decline after reacting to the upper boundary of the Ascending Channel and the resistance zone(221.35 JPY-219.32 JPY).
After breaking below the support lines, the pair formed a Symmetrical Triangle, and its lower trendline has now been broken.
Can GBPJPY recover, or is the pair entering a deeper corrective phase?
Technical Analysis
From an Elliott Wave perspective, GBPJPY appears to have completed its main Five-Wave Impulsive Structure above the Ascending Ch