Tweezer Tops
USDCAD Strong BearishMy 3 reasons to expect bearish:
-Tweezer top pattern on daily which is strong pattern,
-It's rebound from OB area also on daily
-It's rebound from previous resistance
Technically all condition is available to support bearish but the dollar index is still bullish. If index not close over 103.36 this will support my idea.
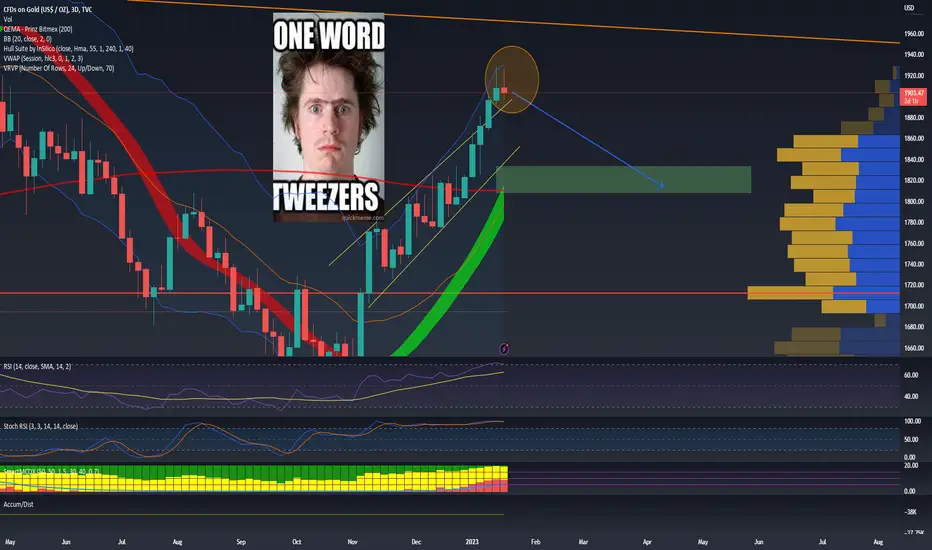
Tweezer Double Top DropI have been noting how over bought gold is for sometime, I think we finally got that blow off top that we needed before going short. I expect this 3 day candle to set near or below the current price unless we get crazy adverse fundamentals. If we set a tweezer top, this will be short term bearish. Not financial advice, DYOR.
LITECOIN to Take $19 Billion From The TOTAL2 Altcoin MarketcapWe have a Bullish 3 Line Strike as well as a Tweezer Top Visible on the Monthly Timeframe which would Currently put LTC on a path to take atleast a 3.7% Market Cap Dominance over the Total2 Crypto Market Cap which at TOTAL2's current USD value would put LTC at a Market Cap of atleast $19 Billion which is a little over 11 times more than it's current Market Cap; Assuming that the Circulating Supply of LTC remains near where it is, that would imply that the LTC/USD price will go up to around $584.
RISKY 10% DOUBLE TOPS TRADE ON THE EURO AUDThis analysis shows the main factors behind the Short Position opened on the EURO AUD. These include
1. The Formation of Double Tops on the Daily Chart.
2. The Formation of a Pennant Setup on the Daily Chart.
3. The expected move towards major Support within 3 Days.
4. The expected move towards the Pennant Support in 7 to 14 Days.
The market provided a strong Tweezer Top to indicate the start of U-Turn on the Daily Chart, which would lead to completion of the Double Tops Signal. Once compl
TU | Descending Breakout | Tweezer Top Entry @ Pullback / RetestTU | Thailand SET Index | Food Sector | Chart Pattern & Price Action Trading
Descending Triangle Breakout with Bearish Tweezer Top Candlestick pattern - Wait for Entry @ Pullback at retest position
Double Bottom & Top
RSI strong bullish signal
MACD about to cross the baseline 0
Trade with affordable risk ratio 3:1
Always respect your stop-loss
Good Luck
DP
AUDCAD rejected at resistance and headed lower.
Since it's multiyear high in Feb, AUDCAD created lower lows and lower highs in April and has continued bearish ever since with a string of consecutive lower highs and lower lows.
We have 2 clearly defined and repeatedly respected trendlines headed lower, created a broadening descending channel.
Price has has multiple attempts to break through this resistance since December 23rd and has failed, most recently with a tweezer top.
Overall this looks like a great opportunity for a high R short
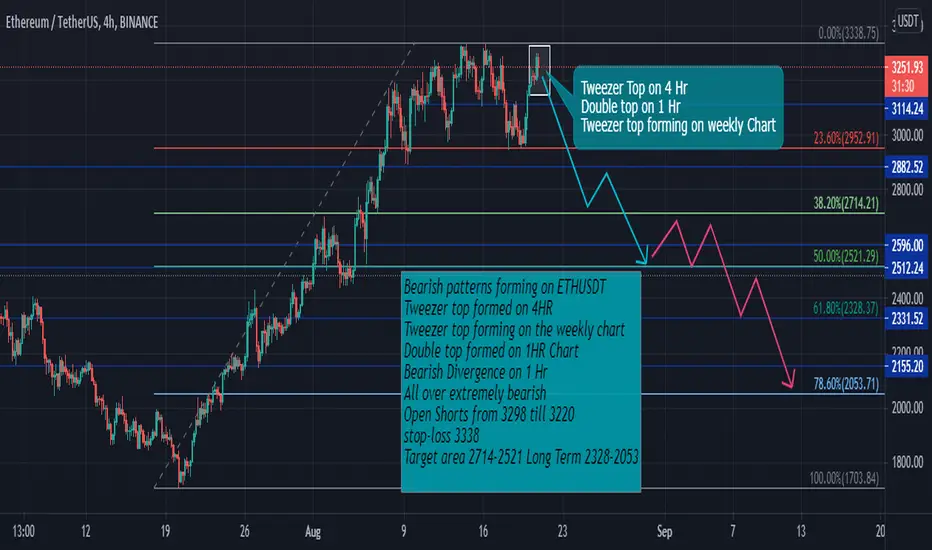
Open Shorts (Maro Bhatay)Bearish patterns forming on ETHUSDT
Tweezer top formed on 4HR
Tweezer top forming on the weekly chart
Double top formed on 1HR Chart
Bearish Divergence on 1 Hr
All over extremely bearish
Open Shorts from 3298 till 3220
stop-loss 3338
Target area 2714-2521 Long Term 2328-2053
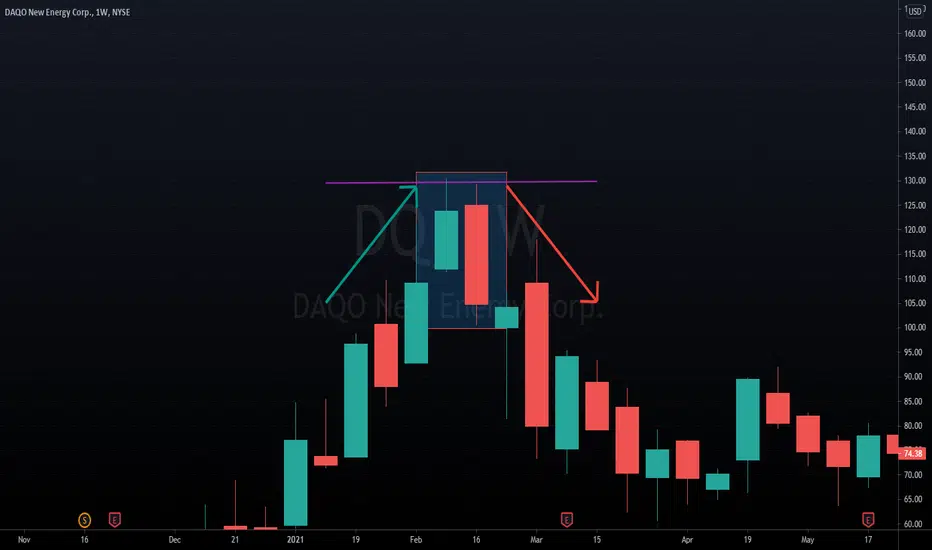
Tweezer Tops and why they're reversal indicatorsHey there. Highlighting one of my favorite candlestick patters, Tweezers.
Identifying:
Green bar. Red bar. Approximately same size bodies. Wicks are the same height. Ezpz.
The story:
During an uptrend, everyone is confident prices will continue to rise, so they continue paying more. "Bulls are in control" but really, it's just the average sentiment; prices are going up so everyone wants a piece before it stops. At some point, early entrants take their profits, prices stop rising, and drop
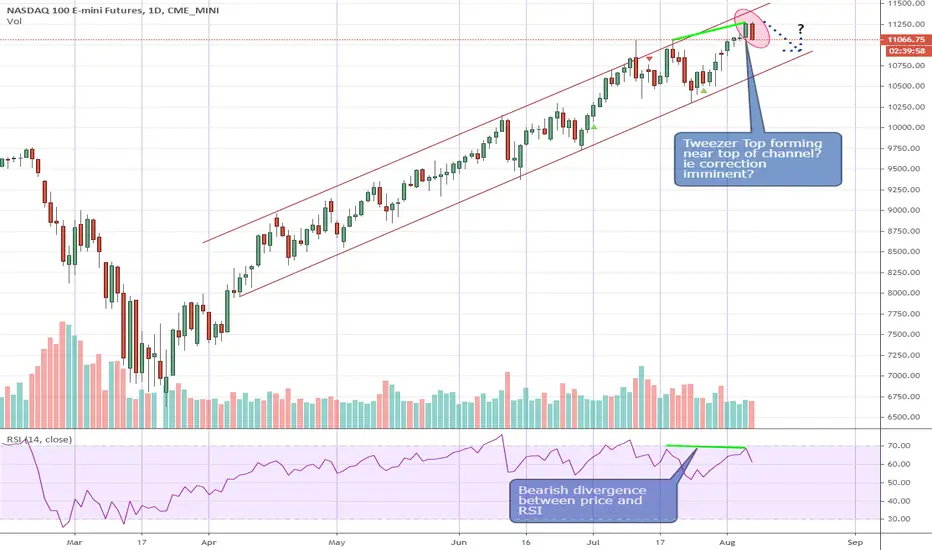
Nasdaq - correction coming??A jittery day plus a possible "tweezer top" candlesticks forming today near the channel top. The day isn't over yet and unless we have a good rebound within the next 2 hours, then it looks like we could be heading into some correction over the next few days.
Go flat, reduce,hedge your longs... or even go temporarily short?
Disclaimer: This is just my own analysis and opinion for discussion and is not a trade advice. Kindly do your own due diligence and trade according to your own risk toler
GLD 1 hour Chart AnalysisSentiment: Neutral to Bearish
As we've observed in the past two weeks Gold has been in a significant uptrend due to its negative correlation with the $DXY (US. Dollar Index) as well as overall volatility in the markets. However as we all know the law of gravity states that all things that go up must eventually come down.
Reasons:
1. Rising Wedge Pattern and Breakdown Confirmation
2. Tweezer Bottom Candlestick Pattern
3. Tweezer Top Candlestick Pattern
NQ Power Range Report with FIB Ext - 8/10/2020 SessionContract - CME_MINI:NQU2020
- High - 11156.75
- Low - 11073.00
*Plus Tweezer Top on the daily chart
Current Stats
- Gap: N/A
- Session Open ATR: 229.06
- Long-term (Daily) Trend: Bullish
Keep in mind this is not speculation or a prediction. Only a report of the Power Range with Fib extensions for target hunting. Do your DD! You determine your risk tolerance. You are fully capable of making your own decisions.
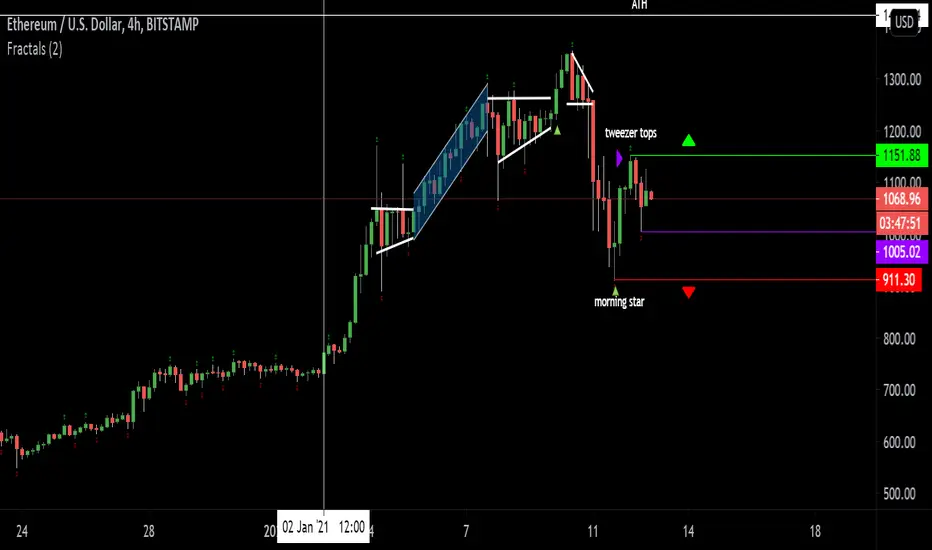
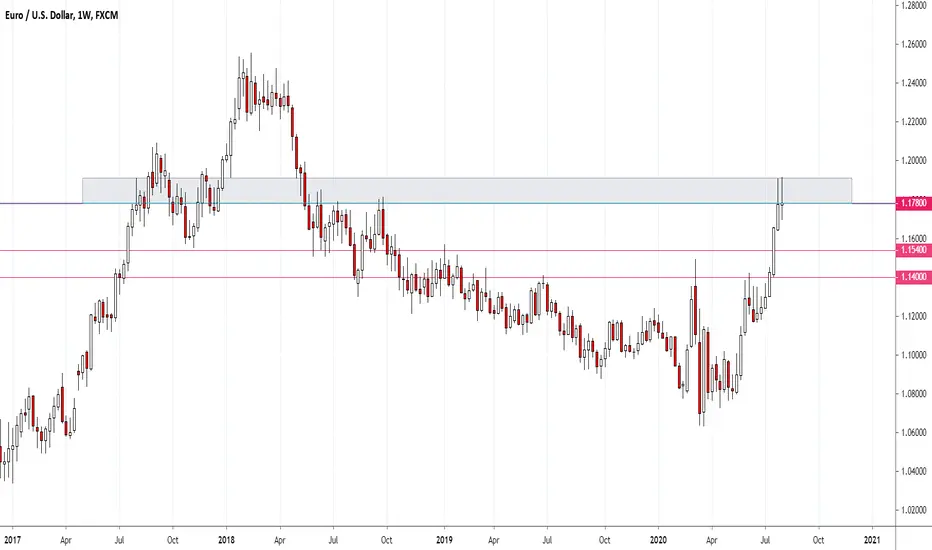
Tweezer tops - EURUSD Traders often talk about several candlesticks and candle patterns but "Tweezer Tops" is rarely mentioned. You can look it up or just look at the weekly chart on EU instead. It is a pattern that could mean trend reversal or at least a short term change in direction.
A few qualifiers are:
- A clear preceding up trend must be present.
- The colour of candles does not matter.
-The top does need to be wicks (it can be full bodies too): the important aspect is almost matching highs.
- More effective