Short
Short
 Short
Short
 Long
Long
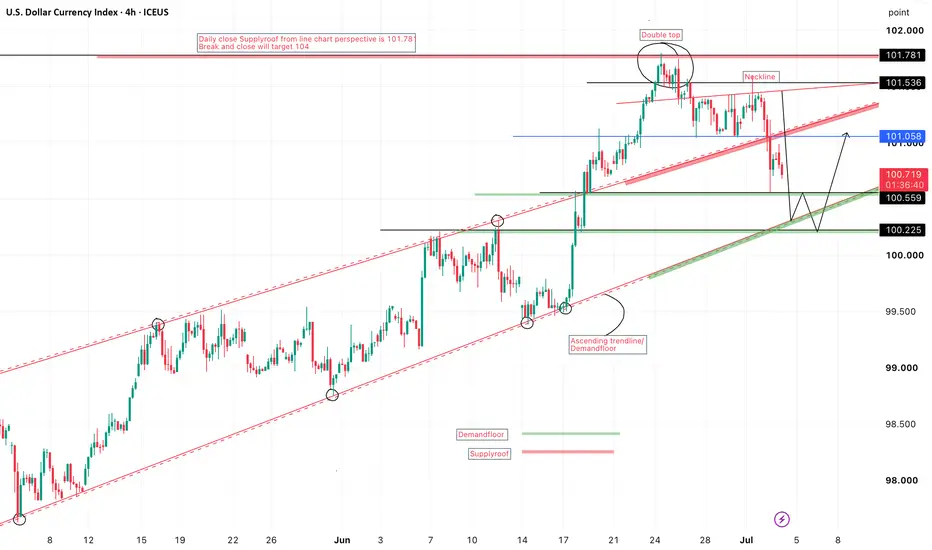
DOLLAR INDEXDollar What is DXY?
The DXY (or USDX) measures the value of the US Dollar (USD) against a weighted basket of six major currencies:
• Euro (EUR) ~57.6%
• Japanese Yen (JPY) ~13.6%
• British Pound (GBP) ~11.9%
• Canadian Dollar (CAD) ~9.1%
• Swedish Krona (SEK) ~4.2%
• Swiss Franc (CHF) ~3.6%
A rising DXY = stronger USD. A falling DXY = weaker USD. Current levels are around 100.8–101 (as of early July 2026). 
How DXY Affects Gold (XAU/USD)
Gold and DXY have a strong negative (inverse) correlation — typically between -0.5 and -0.8 historically. 
• Stronger USD (↑ DXY) → Lower gold prices: Gold is priced in USD. A stronger dollar makes gold more expensive for buyers using other currencies, reducing demand and pressuring prices down.
• Weaker USD (↓ DXY) → Higher gold prices: Gold becomes cheaper for international buyers, boosting demand. Gold also acts as a hedge against dollar weakness.
Exceptions: During extreme crises (e.g., major geopolitical events or simultaneous safe-haven flows), both can sometimes rise together temporarily. 
How DXY Affects Other Currency Pairs (“Other Pairs”)
Since DXY tracks the USD’s strength, it has a direct impact on most USD-based forex pairs:
• Negative correlation pairs (DXY up → pair down):
• EUR/USD: Heavily weighted in DXY — strong inverse link.
• GBP/USD, AUD/USD, NZD/USD, etc. (commodity currencies often move with risk sentiment too).
• Positive correlation pairs (DXY up → pair up):
• USD/JPY, USD/CHF, USD/CAD (these strengthen when USD does).
Practical trading tip: If DXY is breaking higher, expect downward pressure on EUR/USD, GBP/USD, and gold.
#DXY  Long
Long
 Long
Long
 Long
Long
 Long
Long
 Long
Long
GOOGL - High-Confluence Support AheadGOOGL has been in a strong long-term uptrend, consistently respecting its rising wedge structure while printing higher highs and higher lows. 📈
The stock is now retesting a high-confluence support area, where two important technical factors intersect:
• The lower bound of the rising red wedge, acting as dynamic support.
• The blue structure zone, which has previously served as a strong support and resistance area.
📌 As long as this intersection continues to hold, we will be looking for trend-following long setups, anticipating the continuation of the primary bullish trend.
As always, rather than buying immediately, we will wait for bullish confirmation before considering any long positions.
Will this confluence trigger the next bullish impulse? 🤔
⚠️ Disclaimer: This is not financial advice. Always do your own research and manage risk properly.
📚 Stick to your trading plan regarding entries, risk, and management.
Good luck! 🍀
All Strategies Are Good; If Managed Properly!
~Richard Nasr  Long
Long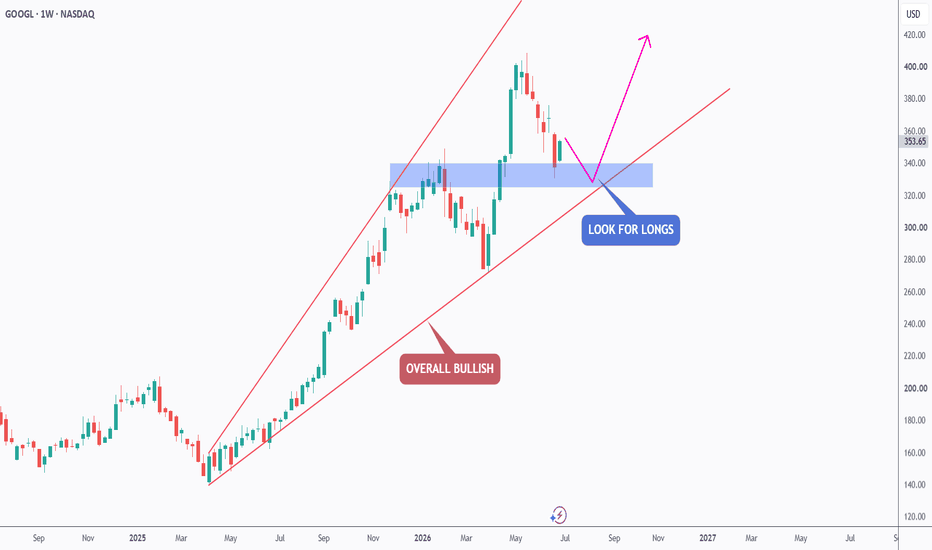
Long 
Short 
 Long
Long
Long 
Turning Conflicting Signals into Structured DecisionsOne of the biggest misconceptions in trading is the belief that every good opportunity should look obvious. Many traders wait for every indicator, every chart pattern, and every momentum signal to point in the same direction before considering a position. While this sounds logical, markets rarely offer such perfect alignment.
Instead, they often present conflicting information. A chart may display a bullish pattern while momentum remains weak. A trend may appear constructive while resistance sits immediately overhead. Oscillators may begin improving before price confirms the move.
At first glance, conflicting signals appear to complicate decision-making. In reality, they can offer one of the most valuable lessons in trading: uncertainty is unavoidable, but risk can still be structured.
This idea can be illustrated using Ether futures as a practical case study.
Every Decision Has Pros and Cons
Trading is not unique in requiring decisions under uncertainty.
Buying a home involves weighing location against cost. Accepting a new job means balancing opportunity against risk. Starting a business requires optimism while acknowledging uncertainty.
Every meaningful decision contains arguments for and against it.
Financial markets are no different.
Waiting until every piece of evidence agrees often means waiting for a move that has already developed. On the other hand, acting on a single indicator while ignoring conflicting information can expose traders to unnecessary risk.
Rather than searching for certainty, experienced traders often focus on building a structured process for evaluating competing evidence.
The objective is not to eliminate uncertainty.
The objective is to make disciplined decisions despite uncertainty.
A Chart That Tells Two Stories
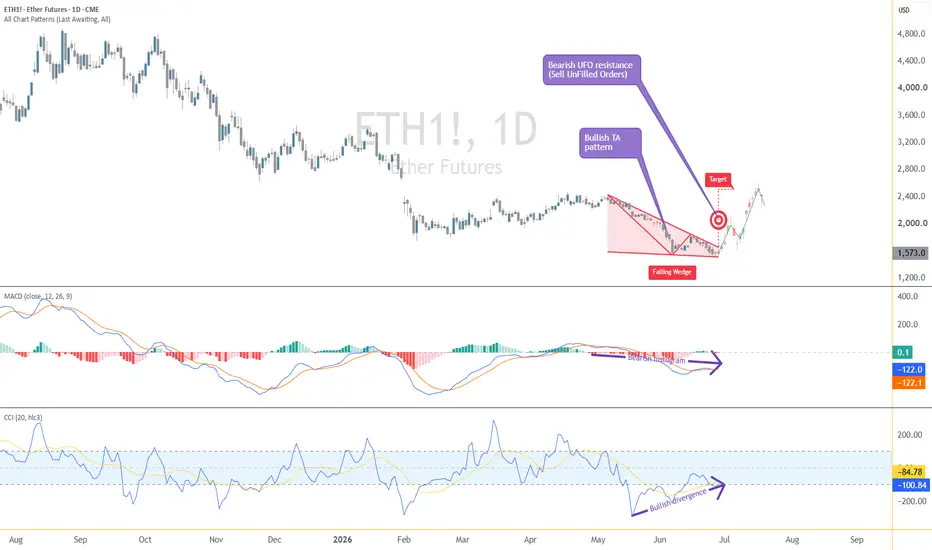
The accompanying daily chart of Ether futures provides an interesting example.
At first glance, several bullish characteristics are visible.
Price has developed a falling wedge, a classical chart pattern frequently associated with the possibility of an upside resolution after a period of declining prices. As the wedge narrows, selling pressure appears to become less aggressive, allowing buyers an opportunity to regain control.
The Commodity Channel Index (CCI) adds another constructive observation.
Although price recently produced lower lows, the CCI formed a bullish divergence, suggesting downside momentum may be weakening. Divergences do not guarantee reversals, but they often encourage traders to monitor price action more closely.
If those were the only observations available, many traders might conclude that the market presents a constructive technical picture.
However, the chart also contains meaningful bearish evidence.
Immediately above price lies a bearish UFO resistance (Sell UnFilled Orders) between approximately 1,959.0 and 2,140.5. This area represents a zone where previously unexecuted sell orders may still be waiting, potentially increasing selling pressure should price revisit the region.
Momentum also introduces caution.
The MACD histogram remains below the zero line, indicating bearish momentum has not fully reversed despite recent price improvement.
The result is a chart where neither buyers nor sellers possess overwhelming technical evidence.
Bullish signals exist.
Bearish signals exist.
Neither side completely dominates the discussion.
For many traders, this is exactly where uncertainty begins.
Replacing Opinions with a Decision Matrix
Instead of asking a simple question—
"Is this chart bullish or bearish?"
—it may be more useful to ask a different one:
"What evidence supports each side?"
Viewed this way, the chart becomes less emotional and more objective.
Bullish observations
Falling wedge pattern.
CCI bullish divergence.
Early signs that selling pressure may be slowing.
Bearish observations
Bearish UFO resistance directly overhead.
MACD histogram remains negative.
Overhead supply may limit upside progress.
Notice that none of these observations automatically invalidates the others.
All of them can be true simultaneously.
Markets frequently contain conflicting information because buyers and sellers are continuously expressing different opinions.
The purpose of technical analysis is not to identify certainty.
It is to organize evidence into a structured decision-making process.
The Hidden Opportunity Inside Conflicting Signals
Many traders stop their analysis once they recognize conflicting signals.
They conclude that uncertainty means no opportunity exists.
Yet conflicting evidence often creates another characteristic that deserves attention.
When opposing technical arguments meet within a relatively narrow price range, the market frequently resolves the disagreement sooner rather than later.
In other words, the market may reveal relatively quickly which side has gained control.
This can create an important advantage from a risk management perspective.
Suppose a trader believes the bullish interpretation deserves greater weight.
If the bullish thesis is correct, price should continue respecting the falling wedge while attempting to challenge the overhead resistance.
If the bullish thesis is incorrect, the market may invalidate the pattern relatively quickly by breaking decisively below the wedge.
The chart therefore provides a clearly identifiable point where the original hypothesis would no longer be supported.
Rather than focusing exclusively on whether the market eventually moves higher, the trader can focus on whether the original idea remains valid.
This distinction is important.
Successful trading is often less about predicting direction and more about defining when a trading idea is no longer supported by evidence.
A Hypothetical Case Study
Consider a purely illustrative example.
A trader observes the falling wedge beginning to resolve to the upside while recognizing that meaningful resistance remains overhead.
Rather than assuming the bullish pattern must succeed, the trader constructs a hypothesis.
The hypothesis could be summarized as follows:
The falling wedge suggests buyers may be regaining control.
The bullish CCI divergence supports the possibility of improving momentum.
Overhead UFO resistance represents the first significant obstacle.
The bearish MACD histogram reminds traders that downside momentum has not fully disappeared.
Under this framework, a hypothetical long position might only be considered after sufficient confirmation that buyers are attempting to regain control.
Equally important, the trader defines an invalidation level before entering the position.
On this chart, a decisive move below approximately 1,504 would represent a meaningful breakdown beneath the falling wedge, suggesting the bullish technical structure has failed.
If that occurs, the original thesis would no longer be supported.
Notice that this approach is not built around certainty.
It is built around predefined risk.
Should the bullish interpretation prove incorrect, the trader knows relatively quickly that the hypothesis requires reassessment.
Conversely, if buyers continue gaining control, price may begin challenging the identified resistance area.
Whether the market ultimately succeeds or fails is less important than the process itself.
The lesson is that structured decisions begin with clearly defining both the opportunity and the conditions under which that opportunity no longer exists.
Ether Futures and Micro Ether Futures
This case study uses CME Ether futures and Micro Ether futures to illustrate the concepts discussed above.
The standard Ether futures contract (ticker: ETH) represents 50 ether, providing exposure suitable for larger notional positions. The Micro Ether futures contract (ticker: MET) represents 0.1 ether, allowing traders to adjust exposure in much smaller increments while following the same underlying market. Both contracts are cash settled using the CME CF Ether-Dollar Reference Rate.
From a contract specification perspective:
ETH (Ether Futures): The minimum price fluctuation for ETH is 0.50 index points, equivalent to $25.00 per contract.
MET (Micro Ether Futures): The minimum price fluctuation for MET is 0.50 index points, equivalent to $0.05 per contract.
Because cryptocurrency markets can experience elevated volatility, margin requirements may change over time.
At the time of writing, traders should expect approximately:
ETH Margin: approximately $25,000 per contract.
MET Margin: approximately $50 per contract.
These figures are exchange requirements and remain subject to periodic adjustment as market conditions evolve. Traders should always verify current requirements with their broker before initiating any position.
The availability of both standard and micro-sized contracts gives market participants flexibility to align position size with their individual risk management framework.
Risk Management Comes Before Direction
Perhaps the most valuable lesson from this chart has little to do with Ether itself.
It concerns risk management.
Charts containing conflicting signals remind traders that no indicator deserves absolute trust.
Instead of searching for perfect agreement, traders may benefit from asking three simple questions:
What evidence supports the trade?
What evidence argues against it?
At what price would my original idea no longer be valid?
Answering those questions before entering a position encourages discipline rather than emotion.
Equally important, a relatively small predefined risk does not imply a trade is "safe."
Unexpected news, volatility, and execution differences can always influence outcomes.
Position sizing should therefore remain consistent with an individual's overall trading plan, regardless of how attractive a particular technical setup may appear.
Being proven wrong quickly is not a failure.
Failing to recognize when the original hypothesis has been invalidated is often the greater risk.
Final Thoughts
Conflicting technical signals are often viewed as obstacles.
In practice, they can become valuable teachers.
They encourage traders to organize evidence objectively rather than searching for certainty where none exists.
The falling wedge, bullish CCI divergence, bearish UFO resistance, and bearish MACD histogram each contribute meaningful information.
None should be ignored.
Rather than asking which indicator is "correct," traders may find greater value in asking how all available evidence fits together within a structured decision-making process.
Markets will always contain uncertainty.
Good risk management does not eliminate that uncertainty.
It simply provides a disciplined framework for navigating it.
Data Consideration
When charting futures, the data provided could be delayed. Traders working with the ticker symbols discussed in this idea may prefer to use CME Group real-time data plan on TradingView: www.tradingview.com - This consideration is particularly important for shorter-term traders, whereas it may be less critical for those focused on longer-term trading strategies.
General Disclaimer
The trade ideas presented herein are solely for illustrative purposes forming a part of a case study intended to demonstrate key principles in risk management within the context of the specific market scenarios discussed. These ideas are not to be interpreted as investment recommendations or financial advice. They do not endorse or promote any specific trading strategies, financial products, or services. The information provided is based on data believed to be reliable; however, its accuracy or completeness cannot be guaranteed. Trading in financial markets involves risks, including the potential loss of principal. Each individual should conduct their own research and consult with professional financial advisors before making any investment decisions. The author or publisher of this content bears no responsibility for any actions taken based on the information provided or for any resultant financial or other losses.  Education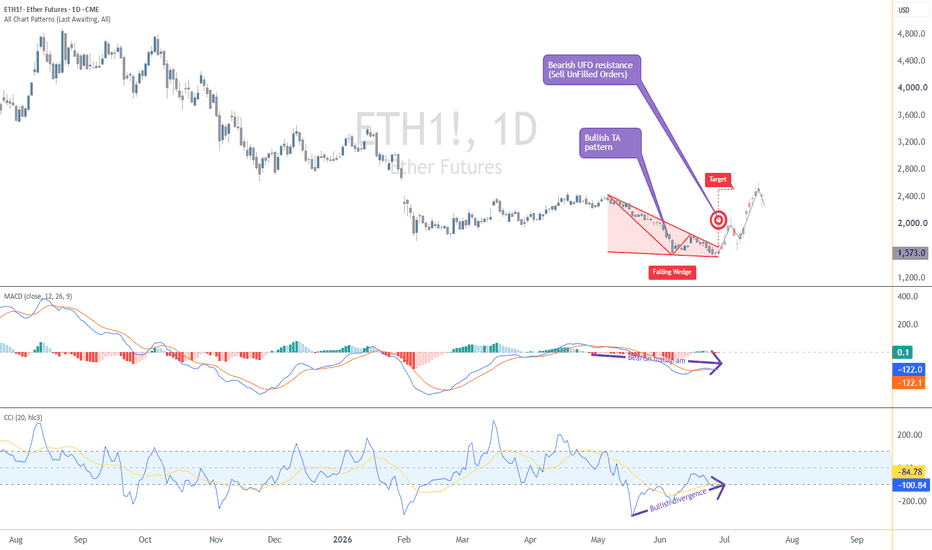
 Long
Long
LLY- Breakout Above Persistent Resistance Opens Strong UpsideNYSE:LLY shares jumped over 7% on Friday on strong volume after positive regulatory and policy developments. The European Medicines Agency’s Committee for Medicinal Products for Human Use backed its cancer drug Jaypirca, while the company’s popular weight-loss treatments are also expected to be included in a new Medicare program, boosting investor sentiment.
With this move, the stock broke above the rising trendline of a rising wedge pattern that had acted as strong resistance four times since July 2024, consistently rejecting price on each test.
A bullish breakout above the upper trendline of a rising wedge can trigger a strong move higher because it goes against the pattern’s usual bearish bias, where rising wedges often end in a breakdown. When price breaks out, short sellers can get trapped and forced to cover, while new breakout buyers step in at the same time, creating a surge in demand. If the breakout happens with strong volume (as it did), it confirms real buying pressure and can lead to fast upside acceleration, sometimes even turning into a parabolic move
Price targets in a rising wedge are based on the pattern’s height projected from the breakout point. Target 1 uses the smaller height between the second top and second bottom (blue trendline), while Target 2 uses the full height from the first top to the first bottom (purple trendline). Target 1 reflects the initial move after breakout, while Target 2 represents the full measured move that usually takes longer to complete.
Trade Idea-
Ideally, I’m looking for a retest of the rising trendline around $1180, followed by a bounce as confirmation of support holding.
Entry: ~$1180
Stop-loss: $1120 (invalidation below trendline)
Target 1: $1578.79 (~+34%, R/R 6.7)
Target 2: $1836.68 (~+55.6%, R/R 10.94)
Clean risk/reward with strong upside if momentum continues.
 Long
Long
 Long
Long
ASAN | Bullish Wedge Ready to Explode | LONGMost of the market looks at Asana (ASAN) and sees a broken chart.
Down massively from its peak and grinding in the high $6 range, the retail crowd has largely given up.
But for technical traders, this is exactly where the best risk-to-reward setups hide. ASAN isn't just randomly drifting lower; it is actively carving out a textbook bullish descending wedge, and the coil is getting incredibly tight.
What is a Descending Wedge?
A descending wedge (also called a falling wedge) is a powerful reversal pattern. It forms when a stock is trapped in a downtrend, but the selling pressure is quietly losing its strength.
Here is how the pattern is currently playing out on the ASAN chart:
Lower Highs: The stock keeps getting rejected at lower prices, forcing the top trendline to point sharply downward.
Lower Lows:
The price continues to drop, forming a bottom trendline.
The Squeeze: This is the key. The bottom trendline is flatter than the top one. Sellers are struggling to push the price significantly lower. The two lines are pinching together, trapping the price in a shrinking box.
Eventually, the price runs out of room to compress. Because the sellers are exhausted, the stock typically breaks out of the top trendline, sparking a sharp rally.
Why ASAN is Ready for Higher Highs
The wedge itself is just a shape. To know it's ready to explode, we have to look under the hood at the momentum and volume.
1. Volume is Drying UpAs ASAN gets squeezed into the very tip of this wedge, the trading volume is fading away. This is exactly what you want to see. It means the "weak hands" have already sold everything they have.
Because there are so few sellers left, it will only take a small burst of buyer demand to push the price through the roof of the wedge.
2. Blinding Bullish Divergence
While the price has been slowly bleeding out into the $6 range, momentum indicators (like the Stochastic RSI) have actually been rising. The price is making lower lows, but the momentum is making higher lows. This divergence is the ultimate warning sign that a trend reversal is imminent.
3. Fundamentals Are Catching UpTechnical breakouts need real-world fuel. While the stock chart has been ugly, Asana's actual business is hitting an inflection point. The company recently posted massive improvements in operating margins and positive free cash flow. Their biggest enterprise clients—those spending over $100,000 a year, are sticking around because Asana is a tool companies use to consolidate their budgets and replace smaller, single-function apps.
The Trade Setup
ASAN is sitting right at the apex of this descending wedge. We are looking for a clean, high-volume break above the upper trendline, which currently sits near the $7.20 to $7.40 zone.
Once that upper ceiling shatters, the algorithm and short-seller buybacks trigger. The technical vacuum above that level leaves the door wide open for a rapid climb back toward the $9.50 to $10.00 range.
The crowd waits to buy until the stock is already making headlines. The smart money buys the wedge.


 Short
Short