OPEN-SOURCE SCRIPT
SVEA - Smart Valuation & Analysis [Gabremoku]
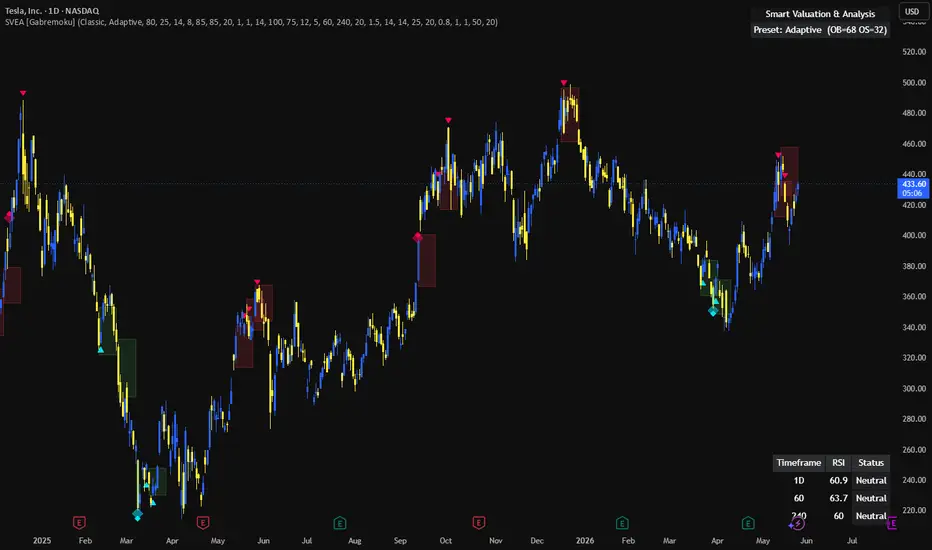
SVEA - Smart Valuation & Analysis [Gabremoku] is a multi-layer technical analysis framework designed to combine adaptive RSI overbought/oversold logic, multi-timeframe confluence, ADX volatility zones, and smart signal visualization into one single chart overlay.
At its core, SVEA uses RSI as the primary valuation engine for detecting overbought and oversold conditions, then expands that logic with adaptive thresholds, asset-specific presets, multi-timeframe confirmation, and ADX-based dynamic price zones. RSI is widely used to spot momentum extremes, but it is often more effective when combined with broader context such as trend strength, volatility, and higher-timeframe confirmation.
The result is a flexible decision-support tool built for traders who want more than a plain oscillator — a full environment for reading exhaustion, confluence, volatility expansion, and reversal potential directly on the chart.
What it shows
📊 Adaptive OB/OS Engine — SVEA uses RSI as the core oscillator and can switch between:
Adaptive thresholds
Auto-detected presets
Equity / Crypto / Forex / 15m presets
Custom levels
Because RSI thresholds often behave differently across instruments and timeframes, adaptive or asset-specific levels can provide more context than rigid 70/30 defaults.
🎯 OB/OS Price Zones — instead of showing only RSI values, the script projects overbought and oversold conditions into visual price bands and event boxes on the chart.
🧠 Multi-Timeframe Confluence — RSI values from the current timeframe plus two higher timeframes are compared in a confluence table, making it easier to identify when conditions align across chart scales. Multi-timeframe RSI is commonly used to improve timing and filter noise.
⚡ ADX Volatility Zones — SVEA combines ADX with Bollinger Band expansion logic to create dynamic top and bottom zones, then generates ADX-based zone-entry signals. ADX is a trend-strength tool, while Bollinger Bands help frame volatility expansion and statistical stretch.
🔺 Adaptive Buy/Sell Signals — buy/sell markers are triggered when RSI exits oversold or overbought conditions, optionally filtered by ADX strength and multi-timeframe confirmation.
🎨 Theme System — choose between a classic look or the Gabremoku visual identity.
Core logic
SVEA is built around four layers:
📉 RSI exhaustion logic — overbought and oversold detection
🧠 adaptive thresholds — levels that adjust with RSI behavior over time
🕒 multi-timeframe confluence — confirmation from higher timeframes
📈 ADX + BB zones — volatility-adjusted structural areas for signal visualization
This is important because RSI alone can remain overbought or oversold for a long time during strong trends, so combining it with ADX and higher-timeframe context helps reduce low-quality reversal signals. RSI is often strongest in ranging environments, while ADX helps identify whether trend conditions are too strong for mean-reversion logic to work cleanly.
Features
✅ RSI-based overbought/oversold framework
✅ Adaptive OB/OS thresholds based on RSI mean and standard deviation
✅ Auto preset detection by asset class and timeframe
✅ Presets for Equity, Crypto, Forex, and 15m charts
✅ Custom OB/OS levels
✅ Continuous or event-based OB/OS price zones
✅ Multi-timeframe RSI confluence table
✅ ADX + Bollinger Band dynamic top/bottom zones
✅ ADX-Buy and ADX-Sell zone-entry signals
✅ Adaptive Buy/Sell signals from RSI exit conditions
✅ Optional ADX confirmation filter
✅ Optional multi-timeframe confirmation filter
✅ Divergence framework inputs and styling foundation
✅ Theme switch between Classic and Gabremoku
✅ Integrated alerts for OB/OS, MTF confluence, and ADX zone signals
How to use
A practical workflow with SVEA is:
🔎 Start with the OB/OS state — determine whether RSI is entering an extreme zone.
🕒 Check the MTF confluence table — if current and higher timeframes align, the setup has stronger context. Multi-timeframe alignment is commonly used to reduce false single-timeframe signals.
📈 Look at ADX conditions — if ADX is high, the market may still be trending strongly, meaning raw RSI reversals can be less reliable. ADX above 25 is often used as a sign of strong trend conditions.
🎯 Use the adaptive buy/sell markers as transition signals when price exits an extreme area rather than blindly reacting to the first OB/OS touch.
Operational suggestion
💡 Suggested trading logic
🔵 Bullish mean-reversion setup: stronger when RSI is oversold, higher timeframes are also oversold or supportive, and price enters the bottom ADX zone. This creates a layered reversal context rather than a single-indicator trigger.
🟨 Bearish mean-reversion setup: stronger when RSI is overbought, higher timeframes confirm the stretch, and price enters the top ADX zone.
⚠️ Strong-trend caution: when ADX is elevated, do not assume every RSI extreme will reverse immediately. A strong ADX often means the current directional move still has strength behind it.
🧠 Best use case: use SVEA as a confluence engine, not as a stand-alone auto-entry tool.
A practical rule:
RSI gives you exhaustion
MTF gives you context
ADX gives you trend strength
Zones give you location
That combination is exactly what makes this script more robust than a standard RSI overlay.
Notes
This script is best described as a technical confluence framework rather than a single-indicator oscillator. It is especially useful for traders who want to visualize when price is statistically stretched, whether that stretch is confirmed across timeframes, and whether trend strength supports or weakens the case for reversal. Confluence-based tools are commonly used to improve selectivity by requiring several conditions to align before acting.
Author: Gabremoku
At its core, SVEA uses RSI as the primary valuation engine for detecting overbought and oversold conditions, then expands that logic with adaptive thresholds, asset-specific presets, multi-timeframe confirmation, and ADX-based dynamic price zones. RSI is widely used to spot momentum extremes, but it is often more effective when combined with broader context such as trend strength, volatility, and higher-timeframe confirmation.
The result is a flexible decision-support tool built for traders who want more than a plain oscillator — a full environment for reading exhaustion, confluence, volatility expansion, and reversal potential directly on the chart.
What it shows
📊 Adaptive OB/OS Engine — SVEA uses RSI as the core oscillator and can switch between:
Adaptive thresholds
Auto-detected presets
Equity / Crypto / Forex / 15m presets
Custom levels
Because RSI thresholds often behave differently across instruments and timeframes, adaptive or asset-specific levels can provide more context than rigid 70/30 defaults.
🎯 OB/OS Price Zones — instead of showing only RSI values, the script projects overbought and oversold conditions into visual price bands and event boxes on the chart.
🧠 Multi-Timeframe Confluence — RSI values from the current timeframe plus two higher timeframes are compared in a confluence table, making it easier to identify when conditions align across chart scales. Multi-timeframe RSI is commonly used to improve timing and filter noise.
⚡ ADX Volatility Zones — SVEA combines ADX with Bollinger Band expansion logic to create dynamic top and bottom zones, then generates ADX-based zone-entry signals. ADX is a trend-strength tool, while Bollinger Bands help frame volatility expansion and statistical stretch.
🔺 Adaptive Buy/Sell Signals — buy/sell markers are triggered when RSI exits oversold or overbought conditions, optionally filtered by ADX strength and multi-timeframe confirmation.
🎨 Theme System — choose between a classic look or the Gabremoku visual identity.
Core logic
SVEA is built around four layers:
📉 RSI exhaustion logic — overbought and oversold detection
🧠 adaptive thresholds — levels that adjust with RSI behavior over time
🕒 multi-timeframe confluence — confirmation from higher timeframes
📈 ADX + BB zones — volatility-adjusted structural areas for signal visualization
This is important because RSI alone can remain overbought or oversold for a long time during strong trends, so combining it with ADX and higher-timeframe context helps reduce low-quality reversal signals. RSI is often strongest in ranging environments, while ADX helps identify whether trend conditions are too strong for mean-reversion logic to work cleanly.
Features
✅ RSI-based overbought/oversold framework
✅ Adaptive OB/OS thresholds based on RSI mean and standard deviation
✅ Auto preset detection by asset class and timeframe
✅ Presets for Equity, Crypto, Forex, and 15m charts
✅ Custom OB/OS levels
✅ Continuous or event-based OB/OS price zones
✅ Multi-timeframe RSI confluence table
✅ ADX + Bollinger Band dynamic top/bottom zones
✅ ADX-Buy and ADX-Sell zone-entry signals
✅ Adaptive Buy/Sell signals from RSI exit conditions
✅ Optional ADX confirmation filter
✅ Optional multi-timeframe confirmation filter
✅ Divergence framework inputs and styling foundation
✅ Theme switch between Classic and Gabremoku
✅ Integrated alerts for OB/OS, MTF confluence, and ADX zone signals
How to use
A practical workflow with SVEA is:
🔎 Start with the OB/OS state — determine whether RSI is entering an extreme zone.
🕒 Check the MTF confluence table — if current and higher timeframes align, the setup has stronger context. Multi-timeframe alignment is commonly used to reduce false single-timeframe signals.
📈 Look at ADX conditions — if ADX is high, the market may still be trending strongly, meaning raw RSI reversals can be less reliable. ADX above 25 is often used as a sign of strong trend conditions.
🎯 Use the adaptive buy/sell markers as transition signals when price exits an extreme area rather than blindly reacting to the first OB/OS touch.
Operational suggestion
💡 Suggested trading logic
🔵 Bullish mean-reversion setup: stronger when RSI is oversold, higher timeframes are also oversold or supportive, and price enters the bottom ADX zone. This creates a layered reversal context rather than a single-indicator trigger.
🟨 Bearish mean-reversion setup: stronger when RSI is overbought, higher timeframes confirm the stretch, and price enters the top ADX zone.
⚠️ Strong-trend caution: when ADX is elevated, do not assume every RSI extreme will reverse immediately. A strong ADX often means the current directional move still has strength behind it.
🧠 Best use case: use SVEA as a confluence engine, not as a stand-alone auto-entry tool.
A practical rule:
RSI gives you exhaustion
MTF gives you context
ADX gives you trend strength
Zones give you location
That combination is exactly what makes this script more robust than a standard RSI overlay.
Notes
This script is best described as a technical confluence framework rather than a single-indicator oscillator. It is especially useful for traders who want to visualize when price is statistically stretched, whether that stretch is confirmed across timeframes, and whether trend strength supports or weakens the case for reversal. Confluence-based tools are commonly used to improve selectivity by requiring several conditions to align before acting.
Author: Gabremoku
Skrip open-source
Dengan semangat TradingView yang sesungguhnya, pembuat skrip ini telah menjadikannya sebagai sumber terbuka, sehingga para trader dapat meninjau dan memverifikasi fungsinya. Salut untuk penulisnya! Meskipun Anda dapat menggunakannya secara gratis, perlu diingat bahwa penerbitan ulang kode ini tunduk pada Tata Tertib kami.

Pernyataan Penyangkalan
Informasi dan publikasi ini tidak dimaksudkan, dan bukan merupakan, saran atau rekomendasi keuangan, investasi, trading, atau jenis lainnya yang diberikan atau didukung oleh TradingView. Baca selengkapnya di Ketentuan Penggunaan.
Skrip open-source
Dengan semangat TradingView yang sesungguhnya, pembuat skrip ini telah menjadikannya sebagai sumber terbuka, sehingga para trader dapat meninjau dan memverifikasi fungsinya. Salut untuk penulisnya! Meskipun Anda dapat menggunakannya secara gratis, perlu diingat bahwa penerbitan ulang kode ini tunduk pada Tata Tertib kami.
Pernyataan Penyangkalan
Informasi dan publikasi ini tidak dimaksudkan, dan bukan merupakan, saran atau rekomendasi keuangan, investasi, trading, atau jenis lainnya yang diberikan atau didukung oleh TradingView. Baca selengkapnya di Ketentuan Penggunaan.