Diupdate
[blackcat] L3 Smart Money Flow
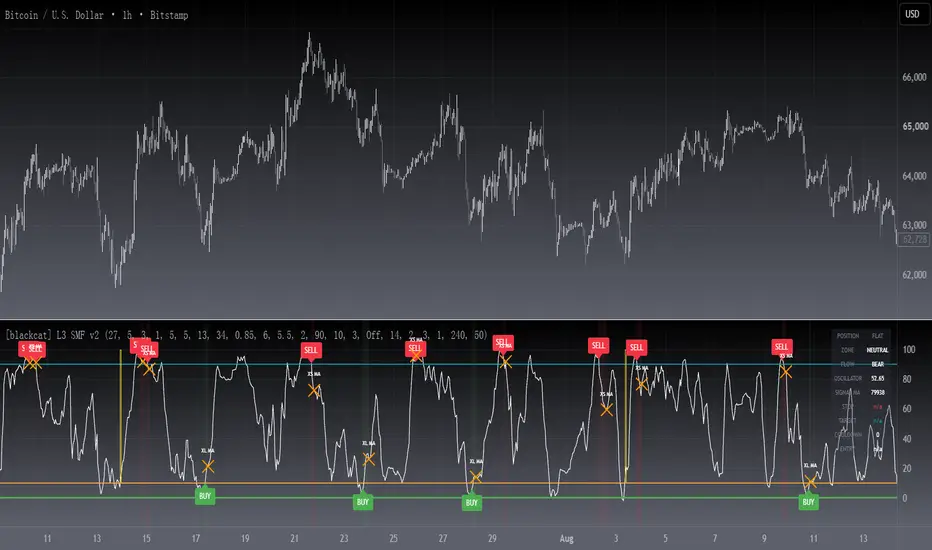
COMPREHENSIVE ANALYSIS OF THE L3 SMART MONEY FLOW INDICATOR
🌐 OVERVIEW:
The [blackcat] L3 Smart Money Flow indicator represents a sophisticated multi-dimensional analytics tool combining traditional momentum measurements with advanced institutional investor tracking capabilities. It's particularly effective at identifying large-scale capital movement dynamics that often precede significant price shifts.
Core Objectives:
• Detect subtle but meaningful price action anomalies indicating major player involvement
• Provide clear entry/exit markers based on multiple validated criteria
• Offer risk-managed positioning strategies suitable for various account sizes
• Maintain operational efficiency even during high volatility regimes
THEORETICAL BACKDROP AND METHODOLOGY
🎓 Conceptual Foundation Principles:
[Smart Money Identification Mechanism:]
Utilizes Time-Varying Moving Averages (TVMA) responding adaptively to changing market states
Implements Extended Smoothing Algorithm (XSA) providing enhanced filtration characteristics
Employs asymmetric weight distribution favoring recent price observations over historical ones
[Institutional Behavior Modeling Layer:]
→ Analyzes price-weighted closing prices incorporating volume influence indirectly
← Applies Asymmetric Local Maximum (ALMA) filters generating institution-specific trends
⟸ Combines multiple temporal perspectives producing robust directional assessments
[Funding Flow Quantification Module:]
✓ Calculates normalized momentum ratios comparing current state against extended range extremes
✗ Filters out insignificant fluctuations via double-stage verification process
⤾ Generates actionable alerts upon exceeding predefined significance boundaries
CONFIGURABLE PARAMETERS IN DEPTH
⚙️ Input Customization Options Detailed Explanation:
[orange]Temporal Resolution Control:
→ TVMA Length Setting:
Minimum value constraint ensuring mathematical validity
Higher numbers increase smoothing effect reducing reaction velocity
Lower intervals enhance responsiveness potentially increasing noise exposure
[grey]Validation Threshold Definition:
↓ Bull-Bear Boundary Level:
Establishes fundamental acceptance/rejection zones
Typically set near extreme values reflecting rare occurrence probability
Can be adjusted per instrument liquidity profiles if necessary
ADVANCED ALGORITHMIC PROCEDURES BREAKDOWN
💻 Internal Operation Architecture:
Base Calculations Infrastructure:
☑ Raw Data Preparation and Normalization
☐ High/Low/Closing Aggregation Processes
☒ Range Estimation Algorithms
Intermediate Transform Engine:
📈 Momentum Ratio Computation Workflow
↔ First Pass XSA Application Details
➖ Second Stage Refinement Mechanics
Final Output Synthesis Framework:
➢ Composite Reading Compilation Logic
➣ Validation Status Determination Process
➤ Alert Trigger Decision Making Structure
INTERACTIVE VISUAL INTERFACE COMPONENTS
🎨 User Experience Interface Elements:
🔵 Plotting Series Hierarchy:
→ Primary FundFlow Signal: White trace marking core oscillator progression
↑ Secondary Confirmation Overlay: Orange/Yellow highlighting validation status
🟥 Risk/Reward Boundaries: Aqua line delineating strategic areas requiring attention
🏷️ Interactive Marker System:
✔ "BUY": Green upward-pointing labels denoting confirmed long entries
❌ "SELL": Red downward-facing badges signaling short setups
PRACTICAL APPLICATION STRATEGY GUIDE
📋 Operational Deployment Instructions:
Strategic Planning Initiatives:
• Define precise profit targets considering realistic reward/risk scenarios
→ Set maximum acceptable loss thresholds protecting available resources adequately
↓ Develop contingency plans addressing unexpected adverse developments promptly
Live Trading Engagement Protocols:
→ Maintaining vigilant monitoring of label placement activities continuously
↓ Tracking order fill success rates across implemented grids regularly
↑ Evaluating system effectiveness compared alternative methodologies periodically
Performance Optimization Techniques:
✔ Implement incremental improvements iteratively throughout lifecycle
❌ Eliminate ineffective component variations systematically
⟹ Ensure proportional growth capability matching user needs appropriately
EFFICIENCY ENHANCEMENT APPROACHES
🚀 Ongoing Development Strategy:
Resource Management Focus Areas:
→ Minimizing redundant computation cycles through intelligent caching mechanisms
↓ Leveraging parallel processing capabilities where feasible efficiently
↑ Optimizing storage access patterns improving response times substantially
Scalability Consideration Factors:
✔ Adapting to varying account sizes/market capitalizations seamlessly
❌ Preventing bottlenecks limiting concurrent operation capacity
⟹ Ensuring balanced growth capability matching evolving requirements accurately
Maintenance Routine Establishment:
✓ Regular codebase updates incorporation keeping functionality current
↓ Periodic performance audits conducting verifying continued effectiveness
↑ Documentation refinement updating explaining any material modifications made
SYSTEMATIC RISK CONTROL MECHANISMS
🛡️ Comprehensive Protection Systems:
Position Sizing Governance:
∅ Never exceed predetermined exposure limitations strictly observed
± Scale entries proportionally according to available resources carefully
× Include slippage allowances within planning stages realistically
Emergency Response Procedures:
↩ Well-defined exit strategies including trailing stops activation logic
🌀 Contingency plan formulation covering worst-case scenario contingencies
⇄ Recovery procedure documentation outlining restoration steps methodically
🌐 OVERVIEW:
The [blackcat] L3 Smart Money Flow indicator represents a sophisticated multi-dimensional analytics tool combining traditional momentum measurements with advanced institutional investor tracking capabilities. It's particularly effective at identifying large-scale capital movement dynamics that often precede significant price shifts.
Core Objectives:
• Detect subtle but meaningful price action anomalies indicating major player involvement
• Provide clear entry/exit markers based on multiple validated criteria
• Offer risk-managed positioning strategies suitable for various account sizes
• Maintain operational efficiency even during high volatility regimes
THEORETICAL BACKDROP AND METHODOLOGY
🎓 Conceptual Foundation Principles:
[Smart Money Identification Mechanism:]
Utilizes Time-Varying Moving Averages (TVMA) responding adaptively to changing market states
Implements Extended Smoothing Algorithm (XSA) providing enhanced filtration characteristics
Employs asymmetric weight distribution favoring recent price observations over historical ones
[Institutional Behavior Modeling Layer:]
→ Analyzes price-weighted closing prices incorporating volume influence indirectly
← Applies Asymmetric Local Maximum (ALMA) filters generating institution-specific trends
⟸ Combines multiple temporal perspectives producing robust directional assessments
[Funding Flow Quantification Module:]
✓ Calculates normalized momentum ratios comparing current state against extended range extremes
✗ Filters out insignificant fluctuations via double-stage verification process
⤾ Generates actionable alerts upon exceeding predefined significance boundaries
CONFIGURABLE PARAMETERS IN DEPTH
⚙️ Input Customization Options Detailed Explanation:
[orange]Temporal Resolution Control:
→ TVMA Length Setting:
Minimum value constraint ensuring mathematical validity
Higher numbers increase smoothing effect reducing reaction velocity
Lower intervals enhance responsiveness potentially increasing noise exposure
[grey]Validation Threshold Definition:
↓ Bull-Bear Boundary Level:
Establishes fundamental acceptance/rejection zones
Typically set near extreme values reflecting rare occurrence probability
Can be adjusted per instrument liquidity profiles if necessary
ADVANCED ALGORITHMIC PROCEDURES BREAKDOWN
💻 Internal Operation Architecture:
Base Calculations Infrastructure:
☑ Raw Data Preparation and Normalization
☐ High/Low/Closing Aggregation Processes
☒ Range Estimation Algorithms
Intermediate Transform Engine:
📈 Momentum Ratio Computation Workflow
↔ First Pass XSA Application Details
➖ Second Stage Refinement Mechanics
Final Output Synthesis Framework:
➢ Composite Reading Compilation Logic
➣ Validation Status Determination Process
➤ Alert Trigger Decision Making Structure
INTERACTIVE VISUAL INTERFACE COMPONENTS
🎨 User Experience Interface Elements:
🔵 Plotting Series Hierarchy:
→ Primary FundFlow Signal: White trace marking core oscillator progression
↑ Secondary Confirmation Overlay: Orange/Yellow highlighting validation status
🟥 Risk/Reward Boundaries: Aqua line delineating strategic areas requiring attention
🏷️ Interactive Marker System:
✔ "BUY": Green upward-pointing labels denoting confirmed long entries
❌ "SELL": Red downward-facing badges signaling short setups
PRACTICAL APPLICATION STRATEGY GUIDE
📋 Operational Deployment Instructions:
Strategic Planning Initiatives:
• Define precise profit targets considering realistic reward/risk scenarios
→ Set maximum acceptable loss thresholds protecting available resources adequately
↓ Develop contingency plans addressing unexpected adverse developments promptly
Live Trading Engagement Protocols:
→ Maintaining vigilant monitoring of label placement activities continuously
↓ Tracking order fill success rates across implemented grids regularly
↑ Evaluating system effectiveness compared alternative methodologies periodically
Performance Optimization Techniques:
✔ Implement incremental improvements iteratively throughout lifecycle
❌ Eliminate ineffective component variations systematically
⟹ Ensure proportional growth capability matching user needs appropriately
EFFICIENCY ENHANCEMENT APPROACHES
🚀 Ongoing Development Strategy:
Resource Management Focus Areas:
→ Minimizing redundant computation cycles through intelligent caching mechanisms
↓ Leveraging parallel processing capabilities where feasible efficiently
↑ Optimizing storage access patterns improving response times substantially
Scalability Consideration Factors:
✔ Adapting to varying account sizes/market capitalizations seamlessly
❌ Preventing bottlenecks limiting concurrent operation capacity
⟹ Ensuring balanced growth capability matching evolving requirements accurately
Maintenance Routine Establishment:
✓ Regular codebase updates incorporation keeping functionality current
↓ Periodic performance audits conducting verifying continued effectiveness
↑ Documentation refinement updating explaining any material modifications made
SYSTEMATIC RISK CONTROL MECHANISMS
🛡️ Comprehensive Protection Systems:
Position Sizing Governance:
∅ Never exceed predetermined exposure limitations strictly observed
± Scale entries proportionally according to available resources carefully
× Include slippage allowances within planning stages realistically
Emergency Response Procedures:
↩ Well-defined exit strategies including trailing stops activation logic
🌀 Contingency plan formulation covering worst-case scenario contingencies
⇄ Recovery procedure documentation outlining restoration steps methodically
Catatan Rilis
█ OVERVIEWSmart Money Flow measures where price sits inside its own recent range, smooths
that reading into a 0-100 flow oscillator and cross-checks it against an
institutional flow line. Version 2 adds symmetric long and short entries,
mirrored exits, ATR stops and targets, labels, a dashboard and a full alert set.
█ CONCEPTS
Accumulation happens when price is pressed into the lower part of its own range
while short-term momentum starts to lift; distribution happens at the opposite
extreme. The indicator models exactly that:
• Range position: price is normalised onto a 0-100 scale inside a rolling
high-low window, so readings stay comparable across symbols.
• Double smoothing: the value is smoothed twice, removing single-bar noise
while keeping the turn of the flow visible.
• Institutional flow: weighted price is averaged at three lengths; the spread
is split into a bull part and a bear part, then smoothed.
• Confluence: a signal needs the oscillator zone and the price-versus-MA side
to agree, which keeps the script quiet in the middle of the range.
█ HOW TO USE
1 — Add the indicator. It draws in its own pane and never covers candles.
2 — Read the zones: below Low Confirmation is the accumulation zone, above the
Bull-Bear Threshold is the distribution zone; in between is neutral.
3 — Wait for a label. Green BUY appears when the oscillator is in the
accumulation zone and price closes above its signal MA; red SELL appears in
the distribution zone with price closing below the signal MA.
4 — Manage the trade with exit labels: XL / XS marks a trend-break exit, and
the suffix TP or SL tells you the exit came from the ATR target or stop.
5 — Optional: set Institutional Flow Filter to Confirm Entry to keep only
signals that agree with the smoothed flow, and enable the HTF Direction Gate
to trade only with the higher timeframe trend.
Key Inputs
• Range Lookback (27), Fast / Slow Smoothing (5 / 3), Signal MA (5).
• Bull-Bear Threshold (90) and Low Confirmation (10): zone boundaries.
• Cooldown Bars (3): minimum spacing between two state changes.
• Stop Loss / Take Profit (2.0 / 3.0 x ATR): volatility-scaled risk levels.
• Flow Display Scale (1.0): display only, fits flow lines into the pane.
█ FEATURES
• Position state machine: no repeated entries, no contradictory signals, hard
same-bar priority for exits.
• Bar-close evaluation: signals confirm on closed bars only, so the chart does
not flicker intrabar.
• ATR exits recalculated at every entry act as independent exit triggers.
• Nine-row status dashboard: position, zone, flow, stop, target, entry.
• Eight alert conditions plus dynamic alerts on bar close.
• Zero-repaint higher timeframe gate built on the previous HTF bar.
█ SIGNALS
• BUY label (green, up): long entry confirmed in the accumulation zone.
• SELL label (red, down): short entry confirmed in the distribution zone.
• XL / XS label (orange cross): exit by trend break, target or stop.
• White line: oscillator. Red: low confirmation. Aqua: bull-bear threshold.
Yellow step line: confirmation pulse.
• Lime / green: institutional bull flow and its smoothed version. Red /
maroon: institutional bear flow and its smoothed version.
• Green or red background tint: current position side.
█ LIMITATIONS
• Built for ranging, mean-reverting conditions; in strong one-way trends the
accumulation zone can stay empty for long stretches.
• The logic is contrarian by nature: entries occur while the crowd is still
selling or buying the extreme, which requires patience.
• When one bar spans both stop and target, the target is assumed first;
intrabar order is not simulated.
• Best on 15m to 4h charts of liquid instruments; illiquid symbols distort the
range normalisation.
█ NOTES
• Every added mechanism has its own switch and a neutral default, so the
original single-line behaviour can be reproduced at any time.
• This is an indicator, not a strategy: it does not execute orders or report
profit and loss.
• Version 2 is a polish of the original L3 Smart Money Flow script.
════════════════════════════════════════════════════════════════════════
For questions or feedback, please use the comments section below.

Don't miss out! The first and most important thing to do is to join my Discord chat now! Click here to start your adventure: discord.com/invite/ZTGpQJq My new github for more pine development soon: github.com/wxt-coder
Pernyataan Penyangkalan
Informasi dan publikasi ini tidak dimaksudkan, dan bukan merupakan, saran atau rekomendasi keuangan, investasi, trading, atau jenis lainnya yang diberikan atau didukung oleh TradingView. Baca selengkapnya di Ketentuan Penggunaan.
Don't miss out! The first and most important thing to do is to join my Discord chat now! Click here to start your adventure: discord.com/invite/ZTGpQJq My new github for more pine development soon: github.com/wxt-coder
Pernyataan Penyangkalan
Informasi dan publikasi ini tidak dimaksudkan, dan bukan merupakan, saran atau rekomendasi keuangan, investasi, trading, atau jenis lainnya yang diberikan atau didukung oleh TradingView. Baca selengkapnya di Ketentuan Penggunaan.