New Highs-New Lows (NYSE & Nasdaq) [TradeThink]
WHAT IT DOES
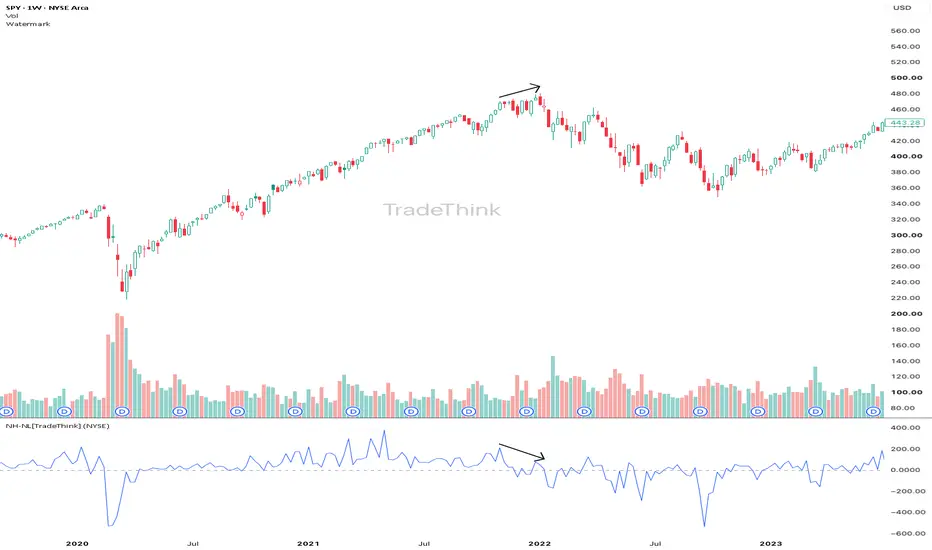
The New Highs – New Lows (NH-NL) indicator is a market breadth tool based on the method described by Stan Weinstein in “Secrets for Profiting in Bull and Bear Markets”. Weinstein used NYSE data, while this indicator also provides Nasdaq and Combined NYSE & Nasdaq options.
It helps identify changes in the technical health of the market that may not be obvious from the major indexes and can provide early signs of weakening or strengthening market conditions.
HOW TO USE IT
It is recommended to use the Weekly chart to focus on longer-term market conditions and reduce short-term noise.
When NH-NL stays consistently above 0, it is generally a bullish sign for the market.
When NH-NL stays consistently below 0, it indicates an unhealthy market.
An important divergence between NH-NL and the major index can be an early sign that the market trend is starting to change.
Around a market bottom, or sometimes slightly before it, NH-NL often drops sharply and deeply into negative territory, then rebounds quickly, forming a very sharp and deep V-shaped recovery.
The NH-NL is one part of market analysis and should not be judged alone. It should be considered together with the overall market trend and other market evidence.
The New Highs – New Lows (NH-NL) indicator is a market breadth tool based on the method described by Stan Weinstein in “Secrets for Profiting in Bull and Bear Markets”. Weinstein used NYSE data, while this indicator also provides Nasdaq and Combined NYSE & Nasdaq options.
It helps identify changes in the technical health of the market that may not be obvious from the major indexes and can provide early signs of weakening or strengthening market conditions.
HOW TO USE IT
It is recommended to use the Weekly chart to focus on longer-term market conditions and reduce short-term noise.
When NH-NL stays consistently above 0, it is generally a bullish sign for the market.
When NH-NL stays consistently below 0, it indicates an unhealthy market.
An important divergence between NH-NL and the major index can be an early sign that the market trend is starting to change.
Around a market bottom, or sometimes slightly before it, NH-NL often drops sharply and deeply into negative territory, then rebounds quickly, forming a very sharp and deep V-shaped recovery.
The NH-NL is one part of market analysis and should not be judged alone. It should be considered together with the overall market trend and other market evidence.

Stage Analysis across the market, industries & stocks. Read more at tradethink.substack.com
Pernyataan Penyangkalan
Informasi dan publikasi ini tidak dimaksudkan, dan bukan merupakan, saran atau rekomendasi keuangan, investasi, trading, atau jenis lainnya yang diberikan atau didukung oleh TradingView. Baca selengkapnya di Ketentuan Penggunaan.
Stage Analysis across the market, industries & stocks. Read more at tradethink.substack.com
Pernyataan Penyangkalan
Informasi dan publikasi ini tidak dimaksudkan, dan bukan merupakan, saran atau rekomendasi keuangan, investasi, trading, atau jenis lainnya yang diberikan atau didukung oleh TradingView. Baca selengkapnya di Ketentuan Penggunaan.