OPEN-SOURCE SCRIPT
Diupdate Session IB Confluence Cockpit
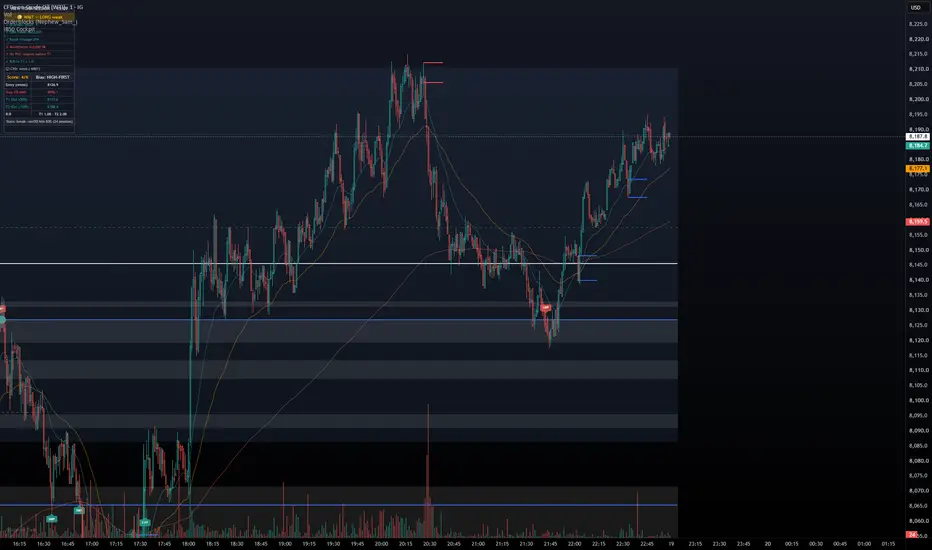
Clearance turns the Initial Balance of each trading session into a clear go / wait / no-go decision. Instead of stacking indicators and eyeballing confluence, you get one verdict panel that weighs six independent conditions and tells you — in plain language — whether the current break is worth taking, and exactly where entry, stop and targets sit.
How it works
Every session (Asia, London, New York) builds its own Initial Balance from the first 30 minutes, its own volume profile, and its own set of levels. When price closes outside the IB, Clearance evaluates the break against six conditions and shows the result as a traffic light:
GREEN — cleared. The break is with the trend, through thin volume, and unobstructed toward target.
YELLOW — wait. A break formed, but something's missing — the panel names exactly what (e.g. a POC magnet in the way, or a neutral trend).
RED — no trade. Price is still inside the IB, or the break fights the trend.
The six conditions
IB break — price has closed outside the Initial Balance
EMA trend — the break is aligned with the 20/50/200 trend
LVN break — price cleared a low-volume node (thin = fast)
VA acceptance — close beyond the value area, not just a spike
No POC magnet — no high-volume node braking the move before T1
R:R ≥ 1.0 — the trade geometry is worth it
GREEN requires the trend and the IB break as hard conditions, plus at least five of six overall — so signals are selective by design.
What you get on the chart
Multi-session IB with mid and ±50% / ±100% extension targets
Per-session volume profile: POC, Value Area (VAH/VAL) and LVN zones, with a clean grayscale histogram that highlights the POC and fades the tails
EMA 20/50/200 trend filter
Automatic entry / stop / target levels with live R-multiples, marked by a circle on the signal candle
Sweep (FBR) markers when price takes out IB or prior-day levels and closes back
A rolling stats read on how often the current break scenario reaches its first extension
Full session history — scroll back and study previous sessions with all their levels intact
Instrument presets for OMX, DAX and NQ (or set your own times manually)
Settings
Everything is adjustable: IB length, value-area %, LVN threshold, profile resolution, how many sessions stay on the chart, dimming of older sessions, colors, and toggles for every visual element. Alerts fire on GREEN long and short.
Notes
Session presets are defined in Central European Time — keep the timezone on Europe/Stockholm. On instruments that report tick volume (e.g. IG cash indices) the profile shape and CVD are tick-based; use them for structure, not absolute contract volume.
This tool is for market analysis and education. It does not predict price and is not financial advice. Always manage your own risk.
How it works
Every session (Asia, London, New York) builds its own Initial Balance from the first 30 minutes, its own volume profile, and its own set of levels. When price closes outside the IB, Clearance evaluates the break against six conditions and shows the result as a traffic light:
GREEN — cleared. The break is with the trend, through thin volume, and unobstructed toward target.
YELLOW — wait. A break formed, but something's missing — the panel names exactly what (e.g. a POC magnet in the way, or a neutral trend).
RED — no trade. Price is still inside the IB, or the break fights the trend.
The six conditions
IB break — price has closed outside the Initial Balance
EMA trend — the break is aligned with the 20/50/200 trend
LVN break — price cleared a low-volume node (thin = fast)
VA acceptance — close beyond the value area, not just a spike
No POC magnet — no high-volume node braking the move before T1
R:R ≥ 1.0 — the trade geometry is worth it
GREEN requires the trend and the IB break as hard conditions, plus at least five of six overall — so signals are selective by design.
What you get on the chart
Multi-session IB with mid and ±50% / ±100% extension targets
Per-session volume profile: POC, Value Area (VAH/VAL) and LVN zones, with a clean grayscale histogram that highlights the POC and fades the tails
EMA 20/50/200 trend filter
Automatic entry / stop / target levels with live R-multiples, marked by a circle on the signal candle
Sweep (FBR) markers when price takes out IB or prior-day levels and closes back
A rolling stats read on how often the current break scenario reaches its first extension
Full session history — scroll back and study previous sessions with all their levels intact
Instrument presets for OMX, DAX and NQ (or set your own times manually)
Settings
Everything is adjustable: IB length, value-area %, LVN threshold, profile resolution, how many sessions stay on the chart, dimming of older sessions, colors, and toggles for every visual element. Alerts fire on GREEN long and short.
Notes
Session presets are defined in Central European Time — keep the timezone on Europe/Stockholm. On instruments that report tick volume (e.g. IG cash indices) the profile shape and CVD are tick-based; use them for structure, not absolute contract volume.
This tool is for market analysis and education. It does not predict price and is not financial advice. Always manage your own risk.
Catatan Rilis
Update — Mobile-friendly displayAdded a Display section so the panel fits smaller screens. New "Panel text size" option (Compact / Normal / Large) — Compact is now the default and keeps the panel narrow so it no longer covers the chart on phones, while still showing every row. Set it to Normal or Large on desktop for roomier text. Also added a "Panel position" option (Top/Bottom, Left/Right, Middle Right) to move the cockpit out of the way. Signal boxes and levels are unchanged.
Catatan Rilis
Update — Mobile display + signal controlsAdded a Display section with a "Panel text size" option (Compact / Normal / Large). Compact is the new default, keeping the panel narrow so it fits mobile screens without covering the chart while still showing every row — set it to Normal or Large for a roomier desktop view. Added a "Panel position" option to move the cockpit out of the way.
Added a master toggle to hide all on-chart signal drawing (box, circle and lines) for a clean chart — alerts still fire on GREEN. Also added "Max signals per session" (default 1), so you now see just the first signal of each session instead of both directions.
Catatan Rilis
Added a "Panel" option with three modes: Full (the whole cockpit), Signal only (just the session header and GREEN/YELLOW/RED verdict), and Off (no panel — chart signals and alerts still work). Combine with "Show trade signals on chart" to run anything from a full dashboard to a completely clean chart.Skrip open-source
Dengan semangat TradingView yang sesungguhnya, pembuat skrip ini telah menjadikannya sebagai sumber terbuka, sehingga para trader dapat meninjau dan memverifikasi fungsinya. Salut untuk penulisnya! Meskipun Anda dapat menggunakannya secara gratis, perlu diingat bahwa penerbitan ulang kode ini tunduk pada Tata Tertib kami.

Pernyataan Penyangkalan
Informasi dan publikasi ini tidak dimaksudkan, dan bukan merupakan, saran atau rekomendasi keuangan, investasi, trading, atau jenis lainnya yang diberikan atau didukung oleh TradingView. Baca selengkapnya di Ketentuan Penggunaan.
Skrip open-source
Dengan semangat TradingView yang sesungguhnya, pembuat skrip ini telah menjadikannya sebagai sumber terbuka, sehingga para trader dapat meninjau dan memverifikasi fungsinya. Salut untuk penulisnya! Meskipun Anda dapat menggunakannya secara gratis, perlu diingat bahwa penerbitan ulang kode ini tunduk pada Tata Tertib kami.
Pernyataan Penyangkalan
Informasi dan publikasi ini tidak dimaksudkan, dan bukan merupakan, saran atau rekomendasi keuangan, investasi, trading, atau jenis lainnya yang diberikan atau didukung oleh TradingView. Baca selengkapnya di Ketentuan Penggunaan.