OPEN-SOURCE SCRIPT
Liquidity Sniper
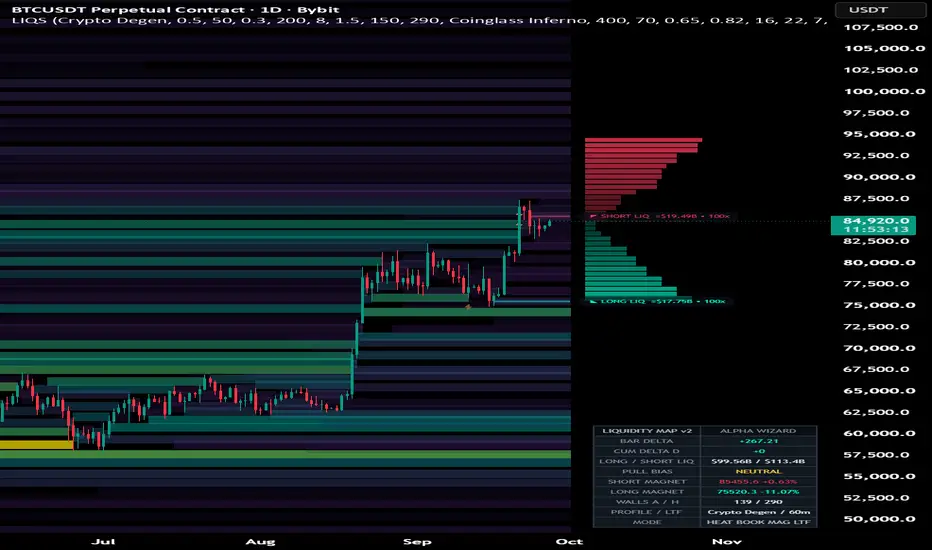
liquidity sniper is a market liquidity mapping tool designed to visualize estimated liquidation zones, stop-liquidity pools, active liquidity walls, historical sweeps, directional magnets, synthetic market depth and volume delta directly on the chart.
the indicator builds a dynamic liquidity map from price, volume, volatility, leverage assumptions and confirmed market structure. active liquidity zones evolve over time, lose intensity through decay and are removed or archived when price reaches them.
the objective is to provide a clearer view of where liquidity may be concentrated around current price and where the market could encounter important pools during expansion, squeezes, flushes or stop-hunt movements.
### liquidation engine
the liquidation engine continuously creates estimated liquidity levels above and below price using several leverage tiers.
available leverage profiles are:
**crypto degen**
places more weight on high-leverage exposure, especially 100x and 50x structures.
**balanced**
uses a more distributed weighting across 100x, 50x, 25x and 10x leverage.
**conservative**
places greater emphasis on lower leverage such as 25x and 10x.
the profile does not represent actual exchange liquidation data. it changes the assumed leverage distribution used by the internal liquidity model.
### maintenance margin
**maintenance margin %** adjusts the margin assumption used when calculating estimated liquidation locations.
changing this value shifts the theoretical liquidation levels generated around the reference price.
### volume baseline length
the indicator compares current volume with a moving volume baseline.
**volume baseline length** controls the number of bars used for this reference.
higher relative volume increases the weight of newly generated liquidity structures.
this allows unusually active periods to contribute more strongly to the liquidity map than low-volume periods.
### cluster merge distance
liquidity levels that appear very close to each other can be combined into a single wall.
**cluster merge distance** defines this distance using atr.
a smaller value keeps nearby liquidity levels more separated.
a larger value combines more levels into common liquidity walls.
when several levels stack together, their intensity accumulates.
### intensity half-life
liquidity does not remain equally important forever.
**intensity half-life** controls how quickly active walls lose strength as new bars appear.
a shorter half-life makes the map adapt faster and removes old liquidity more aggressively.
a longer half-life keeps older structures relevant for longer.
### stop-hunt pivot length
the indicator also detects confirmed pivot highs and lows as potential stop-liquidity locations.
**stop-hunt pivot length** controls the sensitivity of this structure detection.
smaller values detect more local pivots.
larger values focus on broader and more established swing points.
### stop liquidity weight
**stop liquidity weight** controls how much intensity is assigned to liquidity generated from confirmed pivot highs and lows.
increasing this value makes structural stop pools more influential relative to the continuously generated leverage-based walls.
### purge on wick touch
when enabled, a liquidity wall is considered reached as soon as the candle wick touches its price.
when disabled, the calculation uses the candle body instead.
this option changes how aggressively liquidity is considered consumed.
wick mode reacts faster to intrabar price excursions, while body mode requires deeper price acceptance.
### active and historical walls
**max active walls** controls the maximum number of live liquidity structures maintained by the engine.
when the limit is exceeded, weaker active walls are removed first.
**max historical bands** controls how much consumed or expired liquidity can remain in the historical mosaic.
this provides a visual record of where liquidity previously existed and where price interacted with it.
### liquidity heatmap
the heatmap transforms the liquidity model into horizontal intensity bands.
stronger concentrations receive more visual emphasis while weaker liquidity remains more subtle.
two visual themes are available:
**coinglass inferno**
uses a progression from deep purple through violet, teal and green toward yellow-hot liquidity.
**wizard neon**
uses an alternative neon-style liquidity palette.
### grid window
**grid window** defines the rolling price window used to calculate the vertical heatmap structure.
a larger value gives the map a broader historical context.
a smaller value concentrates the visualization on more recent market conditions.
### grid rows
**grid rows** controls the vertical resolution of the liquidity mosaic.
more rows create thinner and more precise bands.
fewer rows create broader visual zones.
increasing resolution can produce a more detailed map but also increases visual density.
### heat gamma
**heat gamma** changes how liquidity intensity is translated into heatmap color.
values below 1 increase the visibility of medium-strength liquidity.
higher values place more visual emphasis on the strongest concentrations.
this setting is useful for adjusting the map when moderate liquidity walls are difficult to distinguish.
### hot-wall glow threshold
the strongest active walls can receive an additional glow and horizontal highlight.
**hot-wall glow threshold** determines how strong a wall must be relative to the current maximum intensity before this effect appears.
higher values reserve the glow for only the most dominant walls.
### synthetic order book
the indicator can display a synthetic depth profile beside current price.
the active liquidity map is divided into price bins above and below the market and converted into horizontal depth bars.
this creates a compact visualization of where the model detects the greatest concentration of liquidity.
this is a synthetic structure derived from the indicator's liquidity model. it is not a direct exchange level 2 order book.
### cumulative depth
when **cumulative depth** is enabled, liquidity is progressively accumulated across the depth bins.
when disabled, each bin represents its own local concentration.
cumulative mode can make larger liquidity imbalances easier to visualize, while non-cumulative mode provides a more granular view of individual zones.
### bins per side
**bins per side** controls the resolution of the synthetic order book above and below current price.
more bins provide finer price segmentation.
fewer bins produce larger aggregated depth zones.
### max wall width
**max wall width** controls the maximum horizontal size of the synthetic depth bars.
stronger depth concentrations produce longer bars relative to weaker ones.
### order book offset
**offset from last bar** controls how far the synthetic order book is positioned from the latest candle.
this can be increased when additional visual space is needed between price action and the depth profile.
### liquidity magnets
the magnet engine searches for important active liquidity concentrations within a configurable distance from current price.
the strongest qualifying wall above price becomes the **short magnet**.
the strongest qualifying wall below price becomes the **long magnet**.
the chart displays these areas using horizontal beams together with their estimated intensity and dominant leverage classification.
a magnet generated from structural stop liquidity is identified as **stops** instead of a leverage tier.
### max magnet distance
**max magnet distance %** limits how far the engine searches for relevant liquidity magnets.
a smaller percentage focuses on nearby liquidity.
a larger percentage allows more distant walls to participate in the calculation.
this also defines the surrounding area used for several liquidity-pool calculations.
### major sweeps
a major sweep occurs when price consumes a sufficiently strong active liquidity wall.
**major sweep threshold** defines how strong the wall must be relative to the maximum current liquidity intensity.
when a qualifying wall is consumed, the indicator can display a sweep flash on the chart.
the number of visible major sweep flashes is intentionally limited to keep the chart readable.
major short-wall sweeps and major long-wall sweeps can also trigger dedicated alerts.
### delta engine
liquidity sniper includes a signed volume delta engine.
when **lower-tf signed volume delta** is enabled, the indicator automatically selects a lower timeframe and analyzes the direction of its candles.
volume from bullish lower-timeframe candles is treated as positive.
volume from bearish lower-timeframe candles is treated as negative.
the resulting values are combined into the current chart bar.
the automatically selected lower timeframe changes according to the chart timeframe.
this provides more granular directional volume information than using only the chart candle.
the calculation is based on lower-timeframe candle direction. it is not exchange bid/ask aggressor delta.
### bar delta
**bar delta** represents the signed volume calculation for the current chart bar.
positive values indicate that the internal lower-timeframe calculation contains more positively signed volume.
negative values indicate more negatively signed volume.
### cumulative delta
the indicator also maintains a daily cumulative delta.
the value resets when a new trading day begins and accumulates confirmed bar delta throughout the session.
a zero-line crossover can generate a cumulative delta flip alert.
### liquidity pull bias
the dashboard compares nearby modeled liquidity above and below current price.
from this distribution it calculates a **pull bias**.
the result can display:
**up**
**down**
**neutral**
this is a liquidity imbalance reading rather than a guaranteed directional forecast.
it can be used to quickly see which side currently contains the larger modeled liquidity pool within the selected search area.
### dashboard
the integrated dashboard provides a compact summary of the current liquidity environment.
it displays:
bar delta
daily cumulative delta
long and short liquidity estimates
liquidity pull bias
nearest short magnet
nearest long magnet
active and historical wall counts
selected leverage profile
automatically selected lower timeframe
currently enabled visualization modes
the dashboard can be positioned in any chart corner.
available text sizes are tiny, small and normal.
it can also be completely disabled when a cleaner chart is preferred.
### alerts
liquidity sniper includes alerts for important liquidity events.
**major short wall swept**
fires when a sufficiently important liquidity wall above price is consumed.
**major long wall swept**
fires when a sufficiently important liquidity wall below price is consumed.
**cumulative delta flip**
fires when the daily cumulative delta crosses zero.
these alerts can be combined with the visual heatmap and magnet structure to monitor important changes without continuously watching the chart.
### quick start
start with the default settings and allow the indicator to build enough history to populate the liquidity map.
first, choose the leverage profile that best matches the type of market being analyzed.
for highly leveraged crypto perpetual markets, **crypto degen** gives greater importance to high-leverage structures.
use **balanced** when a more neutral distribution is preferred.
use **conservative** when lower leverage assumptions are more appropriate.
keep the heatmap enabled and identify the brightest liquidity concentrations around current price.
stronger and hotter bands represent larger modeled liquidity concentrations.
next, compare the closest **short magnet** above price with the closest **long magnet** below price.
the dashboard provides their exact locations while the magnet beams make them visible directly on the chart.
check **pull bias** to compare the total modeled liquidity on both sides of price.
then use **bar delta** and **cumulative delta** as additional context for current directional volume pressure.
watch for major sweep flashes when price reaches a strong wall. a sweep indicates that an important modeled liquidity area has been consumed and should be interpreted in the context of the reaction that follows.
finally, use the synthetic order book to quickly compare how modeled depth is distributed above and below current price.
### adjusting the map
if the chart contains too many small liquidity walls, increase **cluster merge distance** so nearby levels combine more aggressively.
if old liquidity remains visible for too long, reduce **intensity half-life**.
if the map changes too quickly, increase the half-life.
increase **stop-hunt pivot length** when only larger structural highs and lows should contribute stop liquidity.
reduce it when more local swing structures are required.
increase **stop liquidity weight** when confirmed pivot liquidity should have more influence.
reduce it when leverage-derived liquidity should dominate the model.
if the heatmap appears too uniform, adjust **heat gamma** and **hot-wall glow threshold** to create greater separation between moderate and extreme liquidity.
for a cleaner synthetic depth display, reduce the number of order-book bins.
for greater detail, increase the number of bins.
### reading the chart
liquidity above current price represents modeled short-liquidation and stop-liquidity structures.
liquidity below current price represents modeled long-liquidation and stop-liquidity structures.
bright walls indicate stronger relative concentration inside the current map.
magnet beams isolate the strongest nearby qualifying walls.
historical bands show liquidity structures that previously existed before being consumed or removed from the active map.
major sweep flashes mark recent interactions with sufficiently strong walls.
the synthetic order book summarizes the current active map into a compact depth representation.
the dashboard combines these elements with delta and liquidity imbalance information.
### how liquidity sniper can help
liquidity sniper can help organize several forms of market context into a single chart:
mapping estimated liquidation concentrations above and below price
locating potential stop-liquidity pools around confirmed swing highs and lows
identifying the strongest nearby liquidity magnets
visualizing how liquidity develops, decays and disappears over time
distinguishing active liquidity from previously consumed liquidity
highlighting major liquidity sweeps
comparing modeled liquidity above and below current price
monitoring lower-timeframe signed volume delta
tracking daily cumulative delta
visualizing synthetic depth without adding a separate panel
identifying areas where several modeled liquidity levels have merged into stronger walls
reducing the need to manually track multiple liquidity references across the chart
the tool can be particularly useful for studying liquidity around breakouts, stop hunts, squeezes, flushes, range boundaries and high-volatility expansion.
liquidity walls should be treated as areas of interest rather than automatic entry or reversal signals. the liquidation map is an estimation model built from chart data and leverage assumptions, while the synthetic order book is derived from that model rather than direct exchange order-book data.
the strongest use of the indicator is therefore contextual: observe where liquidity is concentrated, how price approaches it, whether the wall is consumed or rejected, what the delta is doing during the interaction, and how the remaining liquidity distribution changes afterward.
the indicator builds a dynamic liquidity map from price, volume, volatility, leverage assumptions and confirmed market structure. active liquidity zones evolve over time, lose intensity through decay and are removed or archived when price reaches them.
the objective is to provide a clearer view of where liquidity may be concentrated around current price and where the market could encounter important pools during expansion, squeezes, flushes or stop-hunt movements.
### liquidation engine
the liquidation engine continuously creates estimated liquidity levels above and below price using several leverage tiers.
available leverage profiles are:
**crypto degen**
places more weight on high-leverage exposure, especially 100x and 50x structures.
**balanced**
uses a more distributed weighting across 100x, 50x, 25x and 10x leverage.
**conservative**
places greater emphasis on lower leverage such as 25x and 10x.
the profile does not represent actual exchange liquidation data. it changes the assumed leverage distribution used by the internal liquidity model.
### maintenance margin
**maintenance margin %** adjusts the margin assumption used when calculating estimated liquidation locations.
changing this value shifts the theoretical liquidation levels generated around the reference price.
### volume baseline length
the indicator compares current volume with a moving volume baseline.
**volume baseline length** controls the number of bars used for this reference.
higher relative volume increases the weight of newly generated liquidity structures.
this allows unusually active periods to contribute more strongly to the liquidity map than low-volume periods.
### cluster merge distance
liquidity levels that appear very close to each other can be combined into a single wall.
**cluster merge distance** defines this distance using atr.
a smaller value keeps nearby liquidity levels more separated.
a larger value combines more levels into common liquidity walls.
when several levels stack together, their intensity accumulates.
### intensity half-life
liquidity does not remain equally important forever.
**intensity half-life** controls how quickly active walls lose strength as new bars appear.
a shorter half-life makes the map adapt faster and removes old liquidity more aggressively.
a longer half-life keeps older structures relevant for longer.
### stop-hunt pivot length
the indicator also detects confirmed pivot highs and lows as potential stop-liquidity locations.
**stop-hunt pivot length** controls the sensitivity of this structure detection.
smaller values detect more local pivots.
larger values focus on broader and more established swing points.
### stop liquidity weight
**stop liquidity weight** controls how much intensity is assigned to liquidity generated from confirmed pivot highs and lows.
increasing this value makes structural stop pools more influential relative to the continuously generated leverage-based walls.
### purge on wick touch
when enabled, a liquidity wall is considered reached as soon as the candle wick touches its price.
when disabled, the calculation uses the candle body instead.
this option changes how aggressively liquidity is considered consumed.
wick mode reacts faster to intrabar price excursions, while body mode requires deeper price acceptance.
### active and historical walls
**max active walls** controls the maximum number of live liquidity structures maintained by the engine.
when the limit is exceeded, weaker active walls are removed first.
**max historical bands** controls how much consumed or expired liquidity can remain in the historical mosaic.
this provides a visual record of where liquidity previously existed and where price interacted with it.
### liquidity heatmap
the heatmap transforms the liquidity model into horizontal intensity bands.
stronger concentrations receive more visual emphasis while weaker liquidity remains more subtle.
two visual themes are available:
**coinglass inferno**
uses a progression from deep purple through violet, teal and green toward yellow-hot liquidity.
**wizard neon**
uses an alternative neon-style liquidity palette.
### grid window
**grid window** defines the rolling price window used to calculate the vertical heatmap structure.
a larger value gives the map a broader historical context.
a smaller value concentrates the visualization on more recent market conditions.
### grid rows
**grid rows** controls the vertical resolution of the liquidity mosaic.
more rows create thinner and more precise bands.
fewer rows create broader visual zones.
increasing resolution can produce a more detailed map but also increases visual density.
### heat gamma
**heat gamma** changes how liquidity intensity is translated into heatmap color.
values below 1 increase the visibility of medium-strength liquidity.
higher values place more visual emphasis on the strongest concentrations.
this setting is useful for adjusting the map when moderate liquidity walls are difficult to distinguish.
### hot-wall glow threshold
the strongest active walls can receive an additional glow and horizontal highlight.
**hot-wall glow threshold** determines how strong a wall must be relative to the current maximum intensity before this effect appears.
higher values reserve the glow for only the most dominant walls.
### synthetic order book
the indicator can display a synthetic depth profile beside current price.
the active liquidity map is divided into price bins above and below the market and converted into horizontal depth bars.
this creates a compact visualization of where the model detects the greatest concentration of liquidity.
this is a synthetic structure derived from the indicator's liquidity model. it is not a direct exchange level 2 order book.
### cumulative depth
when **cumulative depth** is enabled, liquidity is progressively accumulated across the depth bins.
when disabled, each bin represents its own local concentration.
cumulative mode can make larger liquidity imbalances easier to visualize, while non-cumulative mode provides a more granular view of individual zones.
### bins per side
**bins per side** controls the resolution of the synthetic order book above and below current price.
more bins provide finer price segmentation.
fewer bins produce larger aggregated depth zones.
### max wall width
**max wall width** controls the maximum horizontal size of the synthetic depth bars.
stronger depth concentrations produce longer bars relative to weaker ones.
### order book offset
**offset from last bar** controls how far the synthetic order book is positioned from the latest candle.
this can be increased when additional visual space is needed between price action and the depth profile.
### liquidity magnets
the magnet engine searches for important active liquidity concentrations within a configurable distance from current price.
the strongest qualifying wall above price becomes the **short magnet**.
the strongest qualifying wall below price becomes the **long magnet**.
the chart displays these areas using horizontal beams together with their estimated intensity and dominant leverage classification.
a magnet generated from structural stop liquidity is identified as **stops** instead of a leverage tier.
### max magnet distance
**max magnet distance %** limits how far the engine searches for relevant liquidity magnets.
a smaller percentage focuses on nearby liquidity.
a larger percentage allows more distant walls to participate in the calculation.
this also defines the surrounding area used for several liquidity-pool calculations.
### major sweeps
a major sweep occurs when price consumes a sufficiently strong active liquidity wall.
**major sweep threshold** defines how strong the wall must be relative to the maximum current liquidity intensity.
when a qualifying wall is consumed, the indicator can display a sweep flash on the chart.
the number of visible major sweep flashes is intentionally limited to keep the chart readable.
major short-wall sweeps and major long-wall sweeps can also trigger dedicated alerts.
### delta engine
liquidity sniper includes a signed volume delta engine.
when **lower-tf signed volume delta** is enabled, the indicator automatically selects a lower timeframe and analyzes the direction of its candles.
volume from bullish lower-timeframe candles is treated as positive.
volume from bearish lower-timeframe candles is treated as negative.
the resulting values are combined into the current chart bar.
the automatically selected lower timeframe changes according to the chart timeframe.
this provides more granular directional volume information than using only the chart candle.
the calculation is based on lower-timeframe candle direction. it is not exchange bid/ask aggressor delta.
### bar delta
**bar delta** represents the signed volume calculation for the current chart bar.
positive values indicate that the internal lower-timeframe calculation contains more positively signed volume.
negative values indicate more negatively signed volume.
### cumulative delta
the indicator also maintains a daily cumulative delta.
the value resets when a new trading day begins and accumulates confirmed bar delta throughout the session.
a zero-line crossover can generate a cumulative delta flip alert.
### liquidity pull bias
the dashboard compares nearby modeled liquidity above and below current price.
from this distribution it calculates a **pull bias**.
the result can display:
**up**
**down**
**neutral**
this is a liquidity imbalance reading rather than a guaranteed directional forecast.
it can be used to quickly see which side currently contains the larger modeled liquidity pool within the selected search area.
### dashboard
the integrated dashboard provides a compact summary of the current liquidity environment.
it displays:
bar delta
daily cumulative delta
long and short liquidity estimates
liquidity pull bias
nearest short magnet
nearest long magnet
active and historical wall counts
selected leverage profile
automatically selected lower timeframe
currently enabled visualization modes
the dashboard can be positioned in any chart corner.
available text sizes are tiny, small and normal.
it can also be completely disabled when a cleaner chart is preferred.
### alerts
liquidity sniper includes alerts for important liquidity events.
**major short wall swept**
fires when a sufficiently important liquidity wall above price is consumed.
**major long wall swept**
fires when a sufficiently important liquidity wall below price is consumed.
**cumulative delta flip**
fires when the daily cumulative delta crosses zero.
these alerts can be combined with the visual heatmap and magnet structure to monitor important changes without continuously watching the chart.
### quick start
start with the default settings and allow the indicator to build enough history to populate the liquidity map.
first, choose the leverage profile that best matches the type of market being analyzed.
for highly leveraged crypto perpetual markets, **crypto degen** gives greater importance to high-leverage structures.
use **balanced** when a more neutral distribution is preferred.
use **conservative** when lower leverage assumptions are more appropriate.
keep the heatmap enabled and identify the brightest liquidity concentrations around current price.
stronger and hotter bands represent larger modeled liquidity concentrations.
next, compare the closest **short magnet** above price with the closest **long magnet** below price.
the dashboard provides their exact locations while the magnet beams make them visible directly on the chart.
check **pull bias** to compare the total modeled liquidity on both sides of price.
then use **bar delta** and **cumulative delta** as additional context for current directional volume pressure.
watch for major sweep flashes when price reaches a strong wall. a sweep indicates that an important modeled liquidity area has been consumed and should be interpreted in the context of the reaction that follows.
finally, use the synthetic order book to quickly compare how modeled depth is distributed above and below current price.
### adjusting the map
if the chart contains too many small liquidity walls, increase **cluster merge distance** so nearby levels combine more aggressively.
if old liquidity remains visible for too long, reduce **intensity half-life**.
if the map changes too quickly, increase the half-life.
increase **stop-hunt pivot length** when only larger structural highs and lows should contribute stop liquidity.
reduce it when more local swing structures are required.
increase **stop liquidity weight** when confirmed pivot liquidity should have more influence.
reduce it when leverage-derived liquidity should dominate the model.
if the heatmap appears too uniform, adjust **heat gamma** and **hot-wall glow threshold** to create greater separation between moderate and extreme liquidity.
for a cleaner synthetic depth display, reduce the number of order-book bins.
for greater detail, increase the number of bins.
### reading the chart
liquidity above current price represents modeled short-liquidation and stop-liquidity structures.
liquidity below current price represents modeled long-liquidation and stop-liquidity structures.
bright walls indicate stronger relative concentration inside the current map.
magnet beams isolate the strongest nearby qualifying walls.
historical bands show liquidity structures that previously existed before being consumed or removed from the active map.
major sweep flashes mark recent interactions with sufficiently strong walls.
the synthetic order book summarizes the current active map into a compact depth representation.
the dashboard combines these elements with delta and liquidity imbalance information.
### how liquidity sniper can help
liquidity sniper can help organize several forms of market context into a single chart:
mapping estimated liquidation concentrations above and below price
locating potential stop-liquidity pools around confirmed swing highs and lows
identifying the strongest nearby liquidity magnets
visualizing how liquidity develops, decays and disappears over time
distinguishing active liquidity from previously consumed liquidity
highlighting major liquidity sweeps
comparing modeled liquidity above and below current price
monitoring lower-timeframe signed volume delta
tracking daily cumulative delta
visualizing synthetic depth without adding a separate panel
identifying areas where several modeled liquidity levels have merged into stronger walls
reducing the need to manually track multiple liquidity references across the chart
the tool can be particularly useful for studying liquidity around breakouts, stop hunts, squeezes, flushes, range boundaries and high-volatility expansion.
liquidity walls should be treated as areas of interest rather than automatic entry or reversal signals. the liquidation map is an estimation model built from chart data and leverage assumptions, while the synthetic order book is derived from that model rather than direct exchange order-book data.
the strongest use of the indicator is therefore contextual: observe where liquidity is concentrated, how price approaches it, whether the wall is consumed or rejected, what the delta is doing during the interaction, and how the remaining liquidity distribution changes afterward.
Skrip open-source
Dengan semangat TradingView yang sesungguhnya, pembuat skrip ini telah menjadikannya sebagai sumber terbuka, sehingga para trader dapat meninjau dan memverifikasi fungsinya. Salut untuk penulisnya! Meskipun Anda dapat menggunakannya secara gratis, perlu diingat bahwa penerbitan ulang kode ini tunduk pada Tata Tertib kami.

Light the candle that sleeps within you.
Pernyataan Penyangkalan
Informasi dan publikasi ini tidak dimaksudkan, dan bukan merupakan, saran atau rekomendasi keuangan, investasi, trading, atau jenis lainnya yang diberikan atau didukung oleh TradingView. Baca selengkapnya di Ketentuan Penggunaan.
Skrip open-source
Dengan semangat TradingView yang sesungguhnya, pembuat skrip ini telah menjadikannya sebagai sumber terbuka, sehingga para trader dapat meninjau dan memverifikasi fungsinya. Salut untuk penulisnya! Meskipun Anda dapat menggunakannya secara gratis, perlu diingat bahwa penerbitan ulang kode ini tunduk pada Tata Tertib kami.
Light the candle that sleeps within you.
Pernyataan Penyangkalan
Informasi dan publikasi ini tidak dimaksudkan, dan bukan merupakan, saran atau rekomendasi keuangan, investasi, trading, atau jenis lainnya yang diberikan atau didukung oleh TradingView. Baca selengkapnya di Ketentuan Penggunaan.