OPEN-SOURCE SCRIPT
Blue Sky (All-Time High) HUD
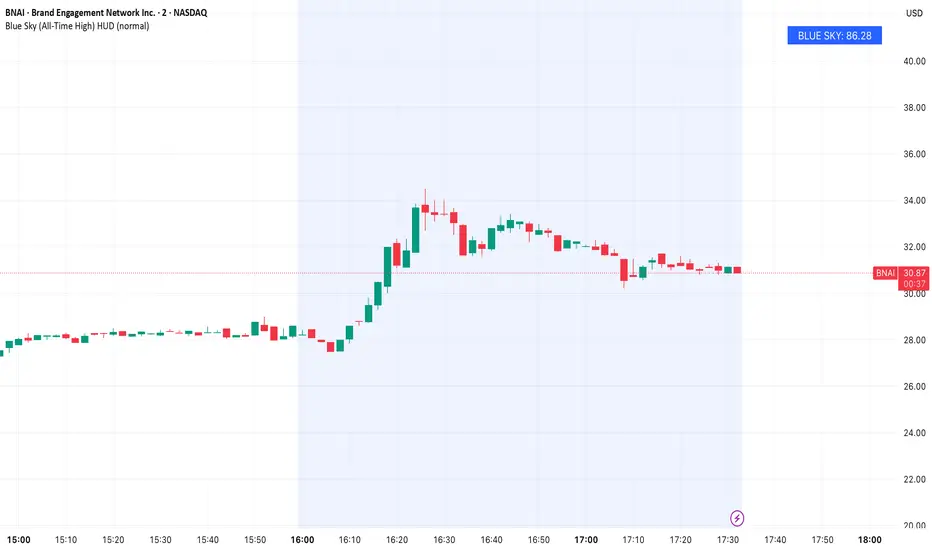
Blue Sky at a Glance
Blue Sky (All-Time High) HUD is a fixed, price-overlay indicator designed to instantly show a stock’s highest price achieved within the loaded chart history, without requiring you to zoom out or scan manually.
Instead of drawing cluttered historical markers, this script calculates the running all-time high and displays it in a clean, fixed HUD anchored to the top-right of the chart.
How It Works
The script continuously tracks the highest high reached on the chart and updates in real time as new highs are made.
The current Blue Sky value is:
Highest high observed within the loaded chart history
The value is displayed in two ways:
• A fixed HUD panel for quick visual reference
• The indicator status line for fast numerical reading
An optional horizontal line can be enabled to visualize the exact level on the chart.
How to Use It
This indicator is informational, not predictive.
Common use cases:
• Instantly see how far price is from its all-time high
• Evaluate overhead supply vs open air
• Contextualize breakouts relative to historical extremes
• Assess long-term expansion potential
Examples:
• Price approaching Blue Sky may indicate major breakout tests
• Price far below Blue Sky may signal long-term recovery room
• New highs automatically update the level in real time
Customization
You can adjust:
• Font size of the HUD display
• Optional visibility of the all-time high line
Design Philosophy
• Fixed, non-moving HUD
• No separate pane
• No repainting
• Lightweight and unobtrusive
• Built for instant context at a glance
This tool is designed for traders who want immediate awareness of a stock’s historical ceiling without disrupting price structure.
Blue Sky (All-Time High) HUD is a fixed, price-overlay indicator designed to instantly show a stock’s highest price achieved within the loaded chart history, without requiring you to zoom out or scan manually.
Instead of drawing cluttered historical markers, this script calculates the running all-time high and displays it in a clean, fixed HUD anchored to the top-right of the chart.
How It Works
The script continuously tracks the highest high reached on the chart and updates in real time as new highs are made.
The current Blue Sky value is:
Highest high observed within the loaded chart history
The value is displayed in two ways:
• A fixed HUD panel for quick visual reference
• The indicator status line for fast numerical reading
An optional horizontal line can be enabled to visualize the exact level on the chart.
How to Use It
This indicator is informational, not predictive.
Common use cases:
• Instantly see how far price is from its all-time high
• Evaluate overhead supply vs open air
• Contextualize breakouts relative to historical extremes
• Assess long-term expansion potential
Examples:
• Price approaching Blue Sky may indicate major breakout tests
• Price far below Blue Sky may signal long-term recovery room
• New highs automatically update the level in real time
Customization
You can adjust:
• Font size of the HUD display
• Optional visibility of the all-time high line
Design Philosophy
• Fixed, non-moving HUD
• No separate pane
• No repainting
• Lightweight and unobtrusive
• Built for instant context at a glance
This tool is designed for traders who want immediate awareness of a stock’s historical ceiling without disrupting price structure.
Skrip open-source
Dengan semangat TradingView yang sesungguhnya, pembuat skrip ini telah menjadikannya sebagai sumber terbuka, sehingga para trader dapat meninjau dan memverifikasi fungsinya. Salut untuk penulisnya! Meskipun Anda dapat menggunakannya secara gratis, perlu diingat bahwa penerbitan ulang kode ini tunduk pada Tata Tertib kami.

Pernyataan Penyangkalan
Informasi dan publikasi ini tidak dimaksudkan, dan bukan merupakan, saran atau rekomendasi keuangan, investasi, trading, atau jenis lainnya yang diberikan atau didukung oleh TradingView. Baca selengkapnya di Ketentuan Penggunaan.
Skrip open-source
Dengan semangat TradingView yang sesungguhnya, pembuat skrip ini telah menjadikannya sebagai sumber terbuka, sehingga para trader dapat meninjau dan memverifikasi fungsinya. Salut untuk penulisnya! Meskipun Anda dapat menggunakannya secara gratis, perlu diingat bahwa penerbitan ulang kode ini tunduk pada Tata Tertib kami.
Pernyataan Penyangkalan
Informasi dan publikasi ini tidak dimaksudkan, dan bukan merupakan, saran atau rekomendasi keuangan, investasi, trading, atau jenis lainnya yang diberikan atau didukung oleh TradingView. Baca selengkapnya di Ketentuan Penggunaan.