Diupdate
G Dinero 200DMA Stretch Meter
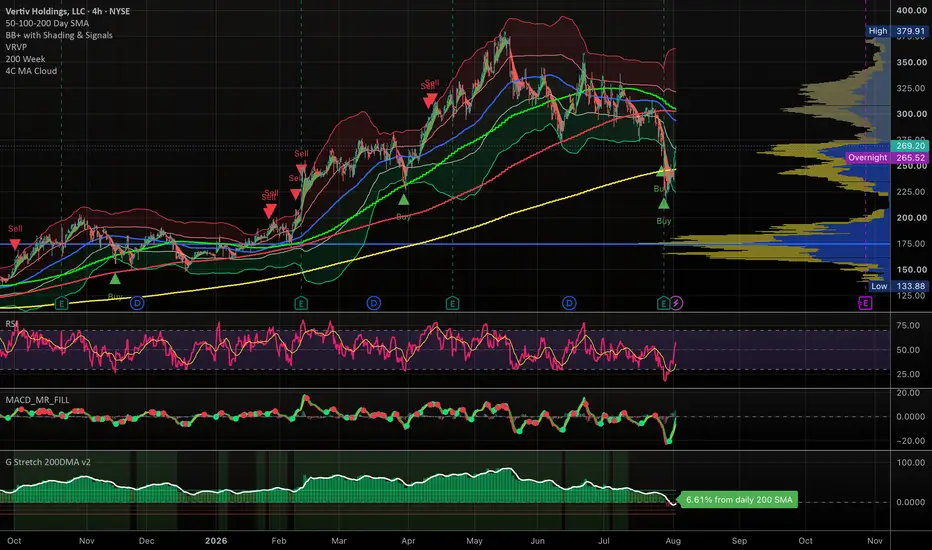
G Dinero 200DMA Stretch Meter
The G Dinero 200DMA Stretch Meter measures how far an asset’s current price is trading above or below its long-term trend using a percentage distance from the selected moving average (default: 200-day moving average).
Instead of simply asking “Is price above or below the 200 DMA?”, this indicator answers:
“By how much?”
### How it Works
The indicator calculates:
(Price − Moving Average) ÷ Moving Average × 100
This creates a percentage-based oscillator showing how stretched an asset is relative to its long-term trend.
Examples:
### Features
✔ Histogram visualization for fast trend/stretched-condition analysis
✔ Optional signal line smoothing to help identify momentum shifts
✔ Custom stretch zones (+/-10%, +/-20%, +/-30% by default)
✔ Extreme overextension background shading
✔ SMA or EMA support
✔ Alert conditions for:
### How I Use It
This indicator is designed to help identify:
Works especially well on high-volatility assets, momentum stocks, indexes, and crypto.
Pro Tip: Every asset behaves differently. Spend time learning what “normal stretch” looks like for the symbols you trade.
The G Dinero 200DMA Stretch Meter measures how far an asset’s current price is trading above or below its long-term trend using a percentage distance from the selected moving average (default: 200-day moving average).
Instead of simply asking “Is price above or below the 200 DMA?”, this indicator answers:
“By how much?”
### How it Works
The indicator calculates:
(Price − Moving Average) ÷ Moving Average × 100
This creates a percentage-based oscillator showing how stretched an asset is relative to its long-term trend.
Examples:
- +20% = price is trading 20% above the moving average
- −15% = price is trading 15% below the moving average
- 0% = price is sitting directly on the moving average
### Features
✔ Histogram visualization for fast trend/stretched-condition analysis
✔ Optional signal line smoothing to help identify momentum shifts
✔ Custom stretch zones (+/-10%, +/-20%, +/-30% by default)
✔ Extreme overextension background shading
✔ SMA or EMA support
✔ Alert conditions for:
- Crossing above/below the moving average
- Extreme stretch levels
- Signal line crossovers
### How I Use It
This indicator is designed to help identify:
- Overextended moves that may be due for mean reversion
- Fear/exhaustion zones after sharp selloffs
- Momentum continuation during strong trending environments
- Better entries/exits by understanding how historically stretched an asset is
Works especially well on high-volatility assets, momentum stocks, indexes, and crypto.
Pro Tip: Every asset behaves differently. Spend time learning what “normal stretch” looks like for the symbols you trade.
Catatan Rilis
Version 2.0This update changes the indicator so that it always calculates the distance from the true daily moving average, regardless of the timeframe being viewed.
Previous versions calculated the moving average using the chart's active timeframe (for example, a 200-period average on a 4-hour chart), which could produce results that differed from the actual 200-day moving average.
Changes included in this release:
• Added request.security() calls to pull daily data directly.
• Corrected stretch calculations so they always reference the true daily moving average.
• Improved consistency across all timeframes (1 hour, 4 hour, daily, weekly, etc.).
• Updated the indicator label to clarify that the calculation is based on daily data.
• No changes were made to the signal logic, thresholds, alerts, colors, or visualization.
Existing users should note that values may differ from earlier versions because the calculation methodology has been corrected.

Pernyataan Penyangkalan
Informasi dan publikasi ini tidak dimaksudkan, dan bukan merupakan, saran atau rekomendasi keuangan, investasi, trading, atau jenis lainnya yang diberikan atau didukung oleh TradingView. Baca selengkapnya di Ketentuan Penggunaan.
Pernyataan Penyangkalan
Informasi dan publikasi ini tidak dimaksudkan, dan bukan merupakan, saran atau rekomendasi keuangan, investasi, trading, atau jenis lainnya yang diberikan atau didukung oleh TradingView. Baca selengkapnya di Ketentuan Penggunaan.