Streak Forward Returns
Description
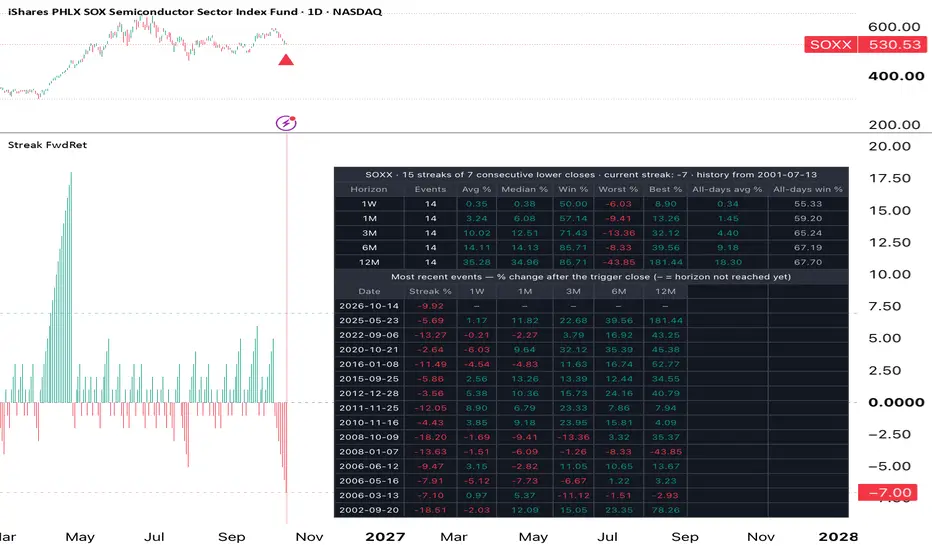
What happens after a market falls, or rises, several days in a row? This indicator answers that question for any symbol on your chart.
It finds every past streak of N consecutive lower or higher closes. It then measures what the price did 1 week, 1 month, 3 months, 6 months and 12 months later. Finally, it compares those results with the symbol’s normal behavior, so you can see whether the streak actually changed the odds.
How it works
Streak counter
The lower pane plots a running count of consecutive closes. Positive bars are higher closes, negative bars are lower closes.
An unchanged close resets the count to zero.
Dashed lines mark the threshold you choose.
Trigger
An event is recorded on the bar where the streak reaches N.
Longer streaks are counted only once. A 9-day losing run with N = 7 produces one event, not three.
Each event is marked on the price chart with a triangle and a shaded background.
Forward returns
Returns are measured from the trigger bar’s close to the close of the first bar on or after the target date.
1W adds 7 calendar days. 1M, 3M, 6M and 12M add calendar months, with the day capped at month end. For example, Jan. 31 plus one month becomes Feb. 28 or 29.
If the target date falls on a weekend or holiday, the next trading session is used.
Baseline
The “All-days” columns calculate the same 1W to 12M returns starting from every bar in the loaded history.
This gives you the unconditional average and win rate.
If the post-streak numbers are not clearly better or worse than the baseline, the streak carries little information.
The table
Stats section, one row per horizon:
Events: the number of completed cases.
Avg %: the average return.
Median %: the median return, which is less distorted by outliers.
Win %: the share of positive outcomes.
Worst % and Best %: the extremes.
All-days avg % and All-days win %: the baseline.
Recent events section: the most recent triggers, each with its date, the total move during the streak, and the return at every horizon. Horizons not yet reached show “–”, so the current streak appears but is not counted in the statistics.
Inputs
Streak direction: Down or Up.
Streak length: 2 to 50 consecutive closes. Default 7.
Number of recent events to list.
Table position, text size and colors.
Alerts
An alert condition fires when the streak reaches the selected length.
Notes and limitations
Timeframe: designed for daily charts. It runs on any timeframe, but the horizons are calendar-based, so on intraday charts the streak counts intraday bars while returns still measure weeks and months.
History: results only use the history loaded on your chart. Long-history symbols may exceed your plan’s bar limit, and the table title shows the first date actually used.
Prices: close-to-close prices, dividends excluded. Enable adjustment for dividends in chart settings if you want total returns on symbols that support it.
Sample size: long streaks are rare, so samples are often small. Treat the results as historical case studies, not as statistical proof.
Not advice: past behavior does not guarantee future results. This tool is for research and education, not a trading signal or investment advice.Pine Script®
What happens after a market falls, or rises, several days in a row? This indicator answers that question for any symbol on your chart.
It finds every past streak of N consecutive lower or higher closes. It then measures what the price did 1 week, 1 month, 3 months, 6 months and 12 months later. Finally, it compares those results with the symbol’s normal behavior, so you can see whether the streak actually changed the odds.
How it works
Streak counter
The lower pane plots a running count of consecutive closes. Positive bars are higher closes, negative bars are lower closes.
An unchanged close resets the count to zero.
Dashed lines mark the threshold you choose.
Trigger
An event is recorded on the bar where the streak reaches N.
Longer streaks are counted only once. A 9-day losing run with N = 7 produces one event, not three.
Each event is marked on the price chart with a triangle and a shaded background.
Forward returns
Returns are measured from the trigger bar’s close to the close of the first bar on or after the target date.
1W adds 7 calendar days. 1M, 3M, 6M and 12M add calendar months, with the day capped at month end. For example, Jan. 31 plus one month becomes Feb. 28 or 29.
If the target date falls on a weekend or holiday, the next trading session is used.
Baseline
The “All-days” columns calculate the same 1W to 12M returns starting from every bar in the loaded history.
This gives you the unconditional average and win rate.
If the post-streak numbers are not clearly better or worse than the baseline, the streak carries little information.
The table
Stats section, one row per horizon:
Events: the number of completed cases.
Avg %: the average return.
Median %: the median return, which is less distorted by outliers.
Win %: the share of positive outcomes.
Worst % and Best %: the extremes.
All-days avg % and All-days win %: the baseline.
Recent events section: the most recent triggers, each with its date, the total move during the streak, and the return at every horizon. Horizons not yet reached show “–”, so the current streak appears but is not counted in the statistics.
Inputs
Streak direction: Down or Up.
Streak length: 2 to 50 consecutive closes. Default 7.
Number of recent events to list.
Table position, text size and colors.
Alerts
An alert condition fires when the streak reaches the selected length.
Notes and limitations
Timeframe: designed for daily charts. It runs on any timeframe, but the horizons are calendar-based, so on intraday charts the streak counts intraday bars while returns still measure weeks and months.
History: results only use the history loaded on your chart. Long-history symbols may exceed your plan’s bar limit, and the table title shows the first date actually used.
Prices: close-to-close prices, dividends excluded. Enable adjustment for dividends in chart settings if you want total returns on symbols that support it.
Sample size: long streaks are rare, so samples are often small. Treat the results as historical case studies, not as statistical proof.
Not advice: past behavior does not guarantee future results. This tool is for research and education, not a trading signal or investment advice.

Pernyataan Penyangkalan
Informasi dan publikasi ini tidak dimaksudkan, dan bukan merupakan, saran atau rekomendasi keuangan, investasi, trading, atau jenis lainnya yang diberikan atau didukung oleh TradingView. Baca selengkapnya di Ketentuan Penggunaan.
Pernyataan Penyangkalan
Informasi dan publikasi ini tidak dimaksudkan, dan bukan merupakan, saran atau rekomendasi keuangan, investasi, trading, atau jenis lainnya yang diberikan atau didukung oleh TradingView. Baca selengkapnya di Ketentuan Penggunaan.