Edo Liquidity Voids
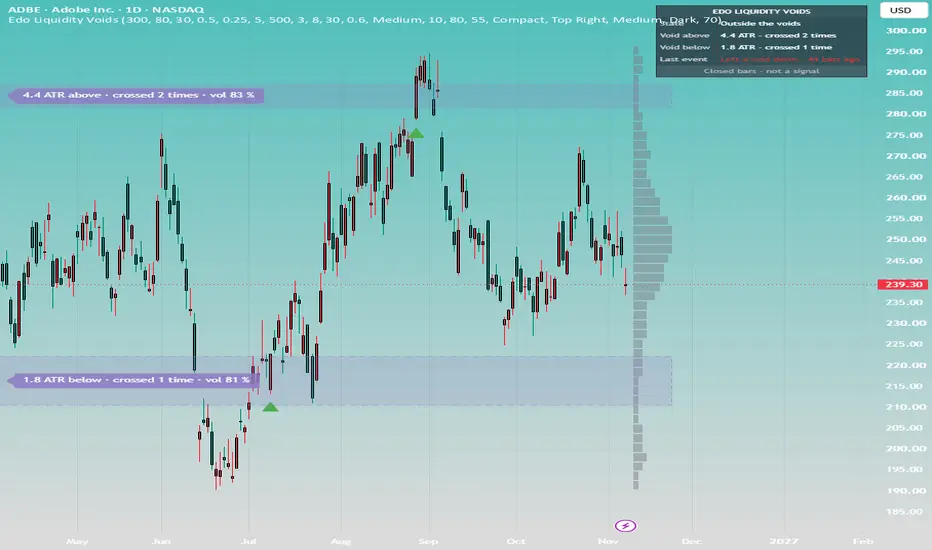
Edo Liquidity Voids — Volume Voids in the Window Profile, Tracked Candle by Candle
A volume profile spreads the volume traded in a window over the price levels where it was traded. Some levels collect a normal amount and a few collect very little. Edo Liquidity Voids scans the profile of the latest 300 closed candles every few candles, finds the stretches of price where very little traded between heavily traded zones, and follows each one candle by candle: whether price has touched it, whether it is inside it, how many times a close has gone through it, how much volume has traded inside it since, how far it is in ATR and how old it is. The indicator is fully self-contained: everything is derived from the price and volume of the chart, with no higher timeframe data and no dependency on any other tool.


On the chart, the profile of the window is drawn at the right edge, with the thin rows in the void colour. The void that contains the price and the three nearest voids on each side are drawn as boxes, each with a label at the left edge of its visible part, such as "2.1 ATR below · intact · vol 20 %". A dashed border means a close has already gone through the void, and a thicker border means the price is inside. Green and red are used only for the triangles that mark a close crossing a void, and an optional small diamond (off by default) marks the candle where a new void is detected. A panel, full or compact, shows the position of the price, the nearest void above and below, the voids followed, the window, the volume source and the last event.
HOW A VOID IS DETECTED
The price range of the window is cut into 80 rows and each candle shares its volume among the rows its range covers. A row is thin when it holds less than 30 % of the median row of the window. Runs of thin rows that are close together are joined as long as the joined zone stays thin on average, and a run only counts if there is volume at least equal to the median row somewhere above it and somewhere below it, so the thin tails of the profile are not voids. The minimum height is 0.5 ATR, measured in 50-bar ATR. Scans run every 5 closed candles, a zone already followed is not detected twice, and at most 30 voids are followed at the same time.
THE LIFE OF A VOID
A void is frozen when it is detected and its top and bottom never move. After that it is intact, tested by a wick or a body, crossed by a close, or has the price inside it. It is retired when the volume traded inside it reaches that of a normal row of its window, which the indicator calls absorbed, or when no candle has touched it for 500 candles. Absorbed is a statement about volume, not about price having closed a gap. Each label shows the percentage of normal volume inside the void, which only grows as volume trades there.
WHAT TO KEEP IN MIND
The profile, the voids, their states, the events and the alerts only change when a candle closes. The distances in the panel and in the labels follow the live price. Part of the drawing follows the visible part of the chart (label position, profile width, voids far outside the visible prices, panel corner), so it can change when you scroll or zoom; the voids, states, events and alerts do not. A box starts at the first candle of the window it was measured on but only appears on the scan candle, up to the scan step later. The profile on the right is rebuilt on every candle while the voids are frozen, so they do not always match. Volume matters: on forex and CFDs the volume is tick volume and the panel says so, symbols with no volume at all, such as some cash indices, are not calculated, and a chart needs 300 closed candles before the first detection. About a third of the voids are mostly a price gap that has not been traded again, and the indicator does not look at candles, so it does not tell them apart. It misleads on intraday stocks with overnight and earnings gaps, on illiquid small caps, on weekly and monthly charts with few candles and after long trends, when every void ends up beyond the display distance. On very short timeframes a long window can make TradingView report that the script takes too long: scan every 10 candles or use a shorter window. The profile can overlap another volume profile drawn at the right edge.
WHAT IT DOES NOT PROMISE
No directional edge and no magnet effect have been found. In an internal measurement on 4,333 daily voids and 15,243 voids on the 1-hour chart, compared with control bands of the same width and distance, the voids were reached as often as the bands, and on the first visit they were crossed slightly less. It is context, never a signal.
ALERTS
Eight predefined alerts: entered a void, crossed a void up, crossed a void down, left a void upward, left a void downward, new void above price, new void below price and void absorbed. All of them are evaluated at the close of the bar.
CONFIGURATION
The inputs are grouped in five blocks. Detection holds the profile window (300 candles), the price rows (80), the void threshold (30 % of the median row), the minimum height (0.5 ATR), the merge distance (0.25 ATR) and how often it scans (5 candles). Lifecycle holds how long a void can go untouched before it is removed (500 candles). Display holds the voids shown per side (3), the distance beyond which voids are hidden (8 ATR), the window profile and its maximum width, the labels with their spacing and size, the crossing markers with a minimum distance between them and the optional diamonds for new voids. Style holds the colours of the void, the profile rows, the crossings and the warnings, plus the fill and profile transparency. Panel controls visibility, full or compact detail, corner, an option that moves the panel to another corner when it would cover the drawing, size, theme (Dark or Light) and opacity.
OPEN SOURCE
Edo Liquidity Voids is published as a free open source indicator. The full Pine Script is publicly accessible on TradingView for study, adaptation and integration into any workflow. Part of the Edolab Markets free tools ecosystem, all available on TradingView.
This indicator is a technical analysis tool for educational and informational purposes only. It does not generate automatic buy or sell signals and should not be considered financial advice. Trading financial markets involves significant risk of capital loss. Past performance does not guarantee future results. Always use proper risk management.
A volume profile spreads the volume traded in a window over the price levels where it was traded. Some levels collect a normal amount and a few collect very little. Edo Liquidity Voids scans the profile of the latest 300 closed candles every few candles, finds the stretches of price where very little traded between heavily traded zones, and follows each one candle by candle: whether price has touched it, whether it is inside it, how many times a close has gone through it, how much volume has traded inside it since, how far it is in ATR and how old it is. The indicator is fully self-contained: everything is derived from the price and volume of the chart, with no higher timeframe data and no dependency on any other tool.
On the chart, the profile of the window is drawn at the right edge, with the thin rows in the void colour. The void that contains the price and the three nearest voids on each side are drawn as boxes, each with a label at the left edge of its visible part, such as "2.1 ATR below · intact · vol 20 %". A dashed border means a close has already gone through the void, and a thicker border means the price is inside. Green and red are used only for the triangles that mark a close crossing a void, and an optional small diamond (off by default) marks the candle where a new void is detected. A panel, full or compact, shows the position of the price, the nearest void above and below, the voids followed, the window, the volume source and the last event.
HOW A VOID IS DETECTED
The price range of the window is cut into 80 rows and each candle shares its volume among the rows its range covers. A row is thin when it holds less than 30 % of the median row of the window. Runs of thin rows that are close together are joined as long as the joined zone stays thin on average, and a run only counts if there is volume at least equal to the median row somewhere above it and somewhere below it, so the thin tails of the profile are not voids. The minimum height is 0.5 ATR, measured in 50-bar ATR. Scans run every 5 closed candles, a zone already followed is not detected twice, and at most 30 voids are followed at the same time.
THE LIFE OF A VOID
A void is frozen when it is detected and its top and bottom never move. After that it is intact, tested by a wick or a body, crossed by a close, or has the price inside it. It is retired when the volume traded inside it reaches that of a normal row of its window, which the indicator calls absorbed, or when no candle has touched it for 500 candles. Absorbed is a statement about volume, not about price having closed a gap. Each label shows the percentage of normal volume inside the void, which only grows as volume trades there.
WHAT TO KEEP IN MIND
The profile, the voids, their states, the events and the alerts only change when a candle closes. The distances in the panel and in the labels follow the live price. Part of the drawing follows the visible part of the chart (label position, profile width, voids far outside the visible prices, panel corner), so it can change when you scroll or zoom; the voids, states, events and alerts do not. A box starts at the first candle of the window it was measured on but only appears on the scan candle, up to the scan step later. The profile on the right is rebuilt on every candle while the voids are frozen, so they do not always match. Volume matters: on forex and CFDs the volume is tick volume and the panel says so, symbols with no volume at all, such as some cash indices, are not calculated, and a chart needs 300 closed candles before the first detection. About a third of the voids are mostly a price gap that has not been traded again, and the indicator does not look at candles, so it does not tell them apart. It misleads on intraday stocks with overnight and earnings gaps, on illiquid small caps, on weekly and monthly charts with few candles and after long trends, when every void ends up beyond the display distance. On very short timeframes a long window can make TradingView report that the script takes too long: scan every 10 candles or use a shorter window. The profile can overlap another volume profile drawn at the right edge.
WHAT IT DOES NOT PROMISE
No directional edge and no magnet effect have been found. In an internal measurement on 4,333 daily voids and 15,243 voids on the 1-hour chart, compared with control bands of the same width and distance, the voids were reached as often as the bands, and on the first visit they were crossed slightly less. It is context, never a signal.
ALERTS
Eight predefined alerts: entered a void, crossed a void up, crossed a void down, left a void upward, left a void downward, new void above price, new void below price and void absorbed. All of them are evaluated at the close of the bar.
CONFIGURATION
The inputs are grouped in five blocks. Detection holds the profile window (300 candles), the price rows (80), the void threshold (30 % of the median row), the minimum height (0.5 ATR), the merge distance (0.25 ATR) and how often it scans (5 candles). Lifecycle holds how long a void can go untouched before it is removed (500 candles). Display holds the voids shown per side (3), the distance beyond which voids are hidden (8 ATR), the window profile and its maximum width, the labels with their spacing and size, the crossing markers with a minimum distance between them and the optional diamonds for new voids. Style holds the colours of the void, the profile rows, the crossings and the warnings, plus the fill and profile transparency. Panel controls visibility, full or compact detail, corner, an option that moves the panel to another corner when it would cover the drawing, size, theme (Dark or Light) and opacity.
OPEN SOURCE
Edo Liquidity Voids is published as a free open source indicator. The full Pine Script is publicly accessible on TradingView for study, adaptation and integration into any workflow. Part of the Edolab Markets free tools ecosystem, all available on TradingView.
This indicator is a technical analysis tool for educational and informational purposes only. It does not generate automatic buy or sell signals and should not be considered financial advice. Trading financial markets involves significant risk of capital loss. Past performance does not guarantee future results. Always use proper risk management.

EdoLab Markets – Precision Trading Tools
Get Exclusive Indicators:
edolab.io
All content provided is for informational and educational purposes only. Past performance does not guarantee future results.
Get Exclusive Indicators:
edolab.io
All content provided is for informational and educational purposes only. Past performance does not guarantee future results.
Pernyataan Penyangkalan
Informasi dan publikasi ini tidak dimaksudkan, dan bukan merupakan, saran atau rekomendasi keuangan, investasi, trading, atau jenis lainnya yang diberikan atau didukung oleh TradingView. Baca selengkapnya di Ketentuan Penggunaan.
EdoLab Markets – Precision Trading Tools
Get Exclusive Indicators:
edolab.io
All content provided is for informational and educational purposes only. Past performance does not guarantee future results.
Get Exclusive Indicators:
edolab.io
All content provided is for informational and educational purposes only. Past performance does not guarantee future results.
Pernyataan Penyangkalan
Informasi dan publikasi ini tidak dimaksudkan, dan bukan merupakan, saran atau rekomendasi keuangan, investasi, trading, atau jenis lainnya yang diberikan atau didukung oleh TradingView. Baca selengkapnya di Ketentuan Penggunaan.