OPEN-SOURCE SCRIPT
SMA Strategy
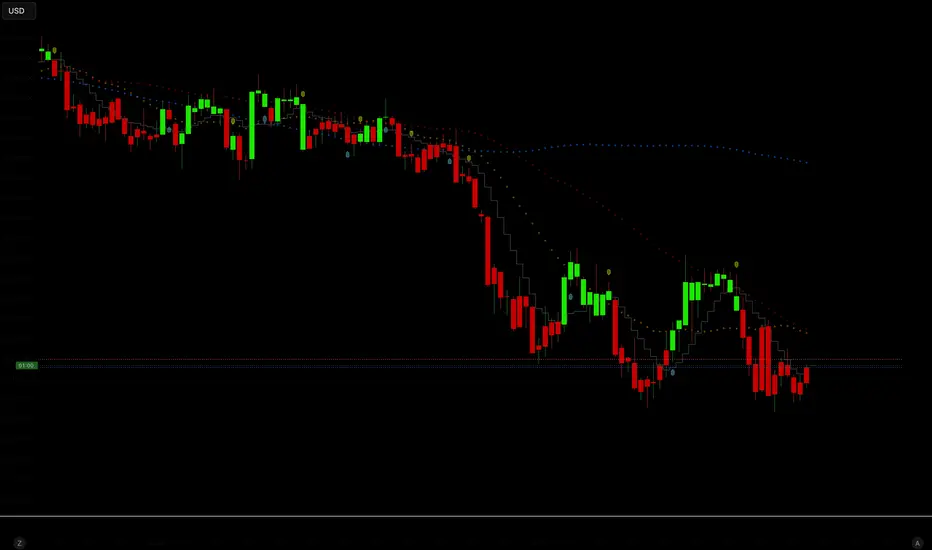
SMA Strategy is a minimalist trend-following trading system built around the interaction of short-term Simple Moving Averages.
The strategy uses the crossover between the SMA 5 and SMA 9 as the primary market trigger, while the SMA 20, SMA 50, and SMA 200 provide additional visual context for short-, medium-, and long-term trend structure.
Core Logic:
A LONG position is opened when the SMA 5 crosses above SMA 9.
A SHORT position is opened when the SMA 5 crosses below SMA 9.
Risk Management
Each trade automatically calculates:
a Stop Loss based on the most recent market structure,
and a Take Profit using a fixed 2:1 risk-to-reward ratio.
For long positions:
Stop Loss = lowest low of the last 5 candles.
Take Profit = entry price + 2× risk.
For short positions:
Stop Loss = highest high of the last 5 candles.
Take Profit = entry price − 2× risk.
This dynamic approach allows the strategy to adapt naturally to changing volatility and price structure.
Visual Features
The script includes multiple visual layers for quick chart interpretation:
SMA 9 displayed as a stepline trigger line.
SMA 20, SMA 50, and SMA 200 plotted as soft circular overlays.
Buy and sell signals plotted directly on the chart.
Candle colors change according to the direction of the SMA 9 trend:
Green candles indicate bullish momentum.
Red candles indicate bearish momentum.
Purpose
The strategy is designed for:
trend continuation trading, short-term momentum detection and clean visual market structure analysis.
Its lightweight construction makes it suitable for discretionary traders, automated backtesting, and further system development.
The strategy uses the crossover between the SMA 5 and SMA 9 as the primary market trigger, while the SMA 20, SMA 50, and SMA 200 provide additional visual context for short-, medium-, and long-term trend structure.
Core Logic:
A LONG position is opened when the SMA 5 crosses above SMA 9.
A SHORT position is opened when the SMA 5 crosses below SMA 9.
Risk Management
Each trade automatically calculates:
a Stop Loss based on the most recent market structure,
and a Take Profit using a fixed 2:1 risk-to-reward ratio.
For long positions:
Stop Loss = lowest low of the last 5 candles.
Take Profit = entry price + 2× risk.
For short positions:
Stop Loss = highest high of the last 5 candles.
Take Profit = entry price − 2× risk.
This dynamic approach allows the strategy to adapt naturally to changing volatility and price structure.
Visual Features
The script includes multiple visual layers for quick chart interpretation:
SMA 9 displayed as a stepline trigger line.
SMA 20, SMA 50, and SMA 200 plotted as soft circular overlays.
Buy and sell signals plotted directly on the chart.
Candle colors change according to the direction of the SMA 9 trend:
Green candles indicate bullish momentum.
Red candles indicate bearish momentum.
Purpose
The strategy is designed for:
trend continuation trading, short-term momentum detection and clean visual market structure analysis.
Its lightweight construction makes it suitable for discretionary traders, automated backtesting, and further system development.
Skrip open-source
Dengan semangat TradingView yang sesungguhnya, pembuat skrip ini telah menjadikannya sebagai sumber terbuka, sehingga para trader dapat meninjau dan memverifikasi fungsinya. Salut untuk penulisnya! Meskipun Anda dapat menggunakannya secara gratis, perlu diingat bahwa penerbitan ulang kode ini tunduk pada Tata Tertib kami.

Pernyataan Penyangkalan
Informasi dan publikasi ini tidak dimaksudkan, dan bukan merupakan, saran atau rekomendasi keuangan, investasi, trading, atau jenis lainnya yang diberikan atau didukung oleh TradingView. Baca selengkapnya di Ketentuan Penggunaan.
Skrip open-source
Dengan semangat TradingView yang sesungguhnya, pembuat skrip ini telah menjadikannya sebagai sumber terbuka, sehingga para trader dapat meninjau dan memverifikasi fungsinya. Salut untuk penulisnya! Meskipun Anda dapat menggunakannya secara gratis, perlu diingat bahwa penerbitan ulang kode ini tunduk pada Tata Tertib kami.
Pernyataan Penyangkalan
Informasi dan publikasi ini tidak dimaksudkan, dan bukan merupakan, saran atau rekomendasi keuangan, investasi, trading, atau jenis lainnya yang diberikan atau didukung oleh TradingView. Baca selengkapnya di Ketentuan Penggunaan.