OPEN-SOURCE SCRIPT
Diupdate Monthly Statistical Levels
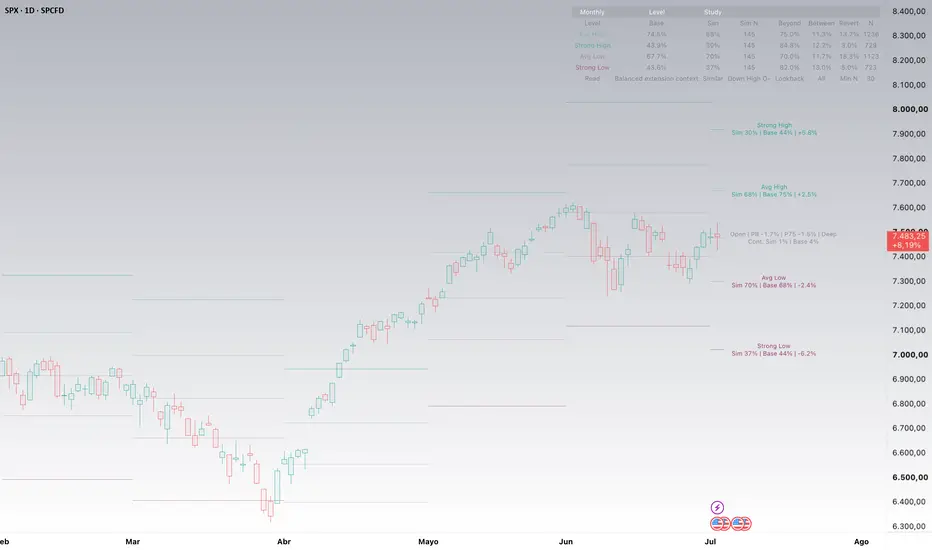
Monthly Statistical Levels is an open-source indicator that plots monthly reference levels based on historical monthly price extensions from the monthly open.
The goal of the script is to provide a clean statistical map for the current and recent months. It is designed as a market structure and reference-level tool, not as a buy/sell signal system.
How it works
The script uses completed monthly candles from TradingView data.
For each completed month, it calculates two historical extensions:
High extension:
Monthly High minus Monthly Open, divided by Monthly Open.
Low extension:
Monthly Open minus Monthly Low, divided by Monthly Open.
These historical extensions are stored separately for upside and downside movement.
At the start of each new month, the script uses the current monthly open and projects five reference levels:
Strong High
Avg High
Open
Avg Low
Strong Low
Avg High is based on the historical average upside extension from the monthly open.
Avg Low is based on the historical average downside extension from the monthly open.
Strong High uses the average upside extension plus a configurable standard deviation multiplier.
Strong Low uses the average downside extension plus a configurable standard deviation multiplier.
By default, the strong multiplier is set to 1.0, meaning strong levels use the historical average extension plus one standard deviation.
Lookback options
Users can choose the statistical lookback used for the calculations:
24 months
36 months
60 months
120 months
All available history
Using all available history can make the levels more stable, but it may also mix different market regimes. This is especially important for assets with structural changes, short trading histories, or very different behavior across cycles.
No lookahead logic
The indicator uses completed monthly candles to build the historical sample.
Each month keeps the levels calculated with the information available at the start of that month. The current month is used only for its monthly open, which is known once the month begins.
This means the levels are not recalculated using future monthly highs or lows.
How to use it
The levels can be used as a visual reference for monthly range structure.
Possible uses include:
Identifying where price is trading relative to its monthly statistical range.
Comparing the current month with recent monthly behavior.
Observing when price reaches average or stronger historical extension zones.
Keeping a cleaner chart with only the most recent visible months.
Main settings
Visible months:
Controls how many recent months are displayed. The default is 6 and the maximum is 12 to keep the chart readable.
Statistical lookback:
Controls the historical sample used to calculate average and strong levels.
Minimum closed months:
Defines the minimum number of completed monthly candles required before plotting levels.
Strong multiplier:
Controls how far strong levels are placed from average extension levels using standard deviation.
Labels:
Users can show labels only for the current month, for all visible months, or turn labels off.
Alerts
The script includes optional alert conditions for touches of:
Strong High
Avg High
Open
Avg Low
Strong Low
Limitations
This indicator does not predict future price movement.
It does not identify support or resistance with certainty.
It does not generate buy or sell signals.
It does not evaluate trend, fundamentals, macro conditions, liquidity, positioning, or news.
The levels depend on the TradingView symbol selected, the available historical data, and the chosen lookback window.
Why it may be useful
Many traders look at monthly opens, monthly ranges, and volatility-based zones separately. This script combines those ideas into one clean open-source tool: monthly open-based statistical levels built from completed historical monthly extensions.
It helps traders visualize where price is trading relative to its own historical monthly behavior, while keeping the chart simple and readable.
The goal of the script is to provide a clean statistical map for the current and recent months. It is designed as a market structure and reference-level tool, not as a buy/sell signal system.
How it works
The script uses completed monthly candles from TradingView data.
For each completed month, it calculates two historical extensions:
High extension:
Monthly High minus Monthly Open, divided by Monthly Open.
Low extension:
Monthly Open minus Monthly Low, divided by Monthly Open.
These historical extensions are stored separately for upside and downside movement.
At the start of each new month, the script uses the current monthly open and projects five reference levels:
Strong High
Avg High
Open
Avg Low
Strong Low
Avg High is based on the historical average upside extension from the monthly open.
Avg Low is based on the historical average downside extension from the monthly open.
Strong High uses the average upside extension plus a configurable standard deviation multiplier.
Strong Low uses the average downside extension plus a configurable standard deviation multiplier.
By default, the strong multiplier is set to 1.0, meaning strong levels use the historical average extension plus one standard deviation.
Lookback options
Users can choose the statistical lookback used for the calculations:
24 months
36 months
60 months
120 months
All available history
Using all available history can make the levels more stable, but it may also mix different market regimes. This is especially important for assets with structural changes, short trading histories, or very different behavior across cycles.
No lookahead logic
The indicator uses completed monthly candles to build the historical sample.
Each month keeps the levels calculated with the information available at the start of that month. The current month is used only for its monthly open, which is known once the month begins.
This means the levels are not recalculated using future monthly highs or lows.
How to use it
The levels can be used as a visual reference for monthly range structure.
Possible uses include:
Identifying where price is trading relative to its monthly statistical range.
Comparing the current month with recent monthly behavior.
Observing when price reaches average or stronger historical extension zones.
Keeping a cleaner chart with only the most recent visible months.
Main settings
Visible months:
Controls how many recent months are displayed. The default is 6 and the maximum is 12 to keep the chart readable.
Statistical lookback:
Controls the historical sample used to calculate average and strong levels.
Minimum closed months:
Defines the minimum number of completed monthly candles required before plotting levels.
Strong multiplier:
Controls how far strong levels are placed from average extension levels using standard deviation.
Labels:
Users can show labels only for the current month, for all visible months, or turn labels off.
Alerts
The script includes optional alert conditions for touches of:
Strong High
Avg High
Open
Avg Low
Strong Low
Limitations
This indicator does not predict future price movement.
It does not identify support or resistance with certainty.
It does not generate buy or sell signals.
It does not evaluate trend, fundamentals, macro conditions, liquidity, positioning, or news.
The levels depend on the TradingView symbol selected, the available historical data, and the chosen lookback window.
Why it may be useful
Many traders look at monthly opens, monthly ranges, and volatility-based zones separately. This script combines those ideas into one clean open-source tool: monthly open-based statistical levels built from completed historical monthly extensions.
It helps traders visualize where price is trading relative to its own historical monthly behavior, while keeping the chart simple and readable.
Catatan Rilis
Major update: Pro labels, context rates and cleaner dashboards.This update turns Monthly Statistical Levels into a more complete monthly market map.
The indicator still keeps its original purpose: projecting monthly statistical levels from the monthly open using completed historical candles only. But now it adds a cleaner research layer around those levels.
What is new:
* Added Display Mode: Clean, Pro and Research.
* Clean mode keeps the chart minimal with only the monthly levels.
* Pro mode adds compact information next to the current month levels.
* Research mode is designed for deeper study with the dashboard enabled.
* Added similar-context touch rates.
* Added historical base touch rates.
* Added distance from current price to each active level.
* Added automatic post-touch labels.
* Added a contained-month reading next to the monthly open.
* Added Dashboard Mode: Off, Nearest and Full.
How to read the Pro labels:
* Base = full historical touch rate for the selected symbol.
* Sim = touch rate in historically similar monthly contexts.
* Distance = current distance from price to that level.
* Contained = historical rate of months that stayed between Avg High and Avg Low.
* After a level is touched, the label switches to post-touch reaction stats.
Example:
Avg High
Sim 80% | Base 75% | +4.1%
This means that, in similar historical monthly contexts, Avg High was reached 80% of the time, while its full historical touch rate was 75%. The level is currently 4.1% above price.
If a level is touched, the label changes to something like:
Avg Low touched
Beyond 70% | Rev 18%
This shows what historically happened after that level was touched.
Important note:
These are historical reference statistics, not forecasts, signals or recommendations. The goal is not to tell the user what to buy or sell. The goal is to organize monthly price structure, show where the statistically relevant levels are, and provide historical context around how price has behaved near those levels.
Catatan Rilis
Update: Pullback Map, dynamic alerts and visual refinements.This update keeps the Monthly Statistical Levels framework intact and adds a new optional Pullback Map layer.
What is new:
- Added optional Pullback Map.
- Pullback Map compares the current rolling pullback from the recent highest close against the historical P75 observed rolling pullback depth during trend-evidence regimes.
- The monthly open label can now include PB, P75 and Normal/Deep pullback context when Pullback Map is enabled.
- Added a trend-evidence filter for the Pullback Map.
- Added minimum pullback sample control to avoid showing weak pullback statistics with insufficient observations.
- Added minimum current line length so new-month levels remain visually readable during the first bars of the month.
- Added line label size control.
- Added improved alert architecture with legacy alertconditions and optional dynamic alert() messages.
Existing features remain:
- Clean, Pro and Research display modes.
- Similar-context touch rates.
- Historical base touch rates.
- Contained-month statistics.
- Nearest and Full dashboard modes.
- Post-touch reaction statistics.
Important note:
All values are historical reference statistics for the selected symbol. They are not forecasts, recommendations or trading signals.
Skrip open-source
Dengan semangat TradingView yang sesungguhnya, pembuat skrip ini telah menjadikannya sebagai sumber terbuka, sehingga para trader dapat meninjau dan memverifikasi fungsinya. Salut untuk penulisnya! Meskipun Anda dapat menggunakannya secara gratis, perlu diingat bahwa penerbitan ulang kode ini tunduk pada Tata Tertib kami.

Pernyataan Penyangkalan
Informasi dan publikasi ini tidak dimaksudkan, dan bukan merupakan, saran atau rekomendasi keuangan, investasi, trading, atau jenis lainnya yang diberikan atau didukung oleh TradingView. Baca selengkapnya di Ketentuan Penggunaan.
Skrip open-source
Dengan semangat TradingView yang sesungguhnya, pembuat skrip ini telah menjadikannya sebagai sumber terbuka, sehingga para trader dapat meninjau dan memverifikasi fungsinya. Salut untuk penulisnya! Meskipun Anda dapat menggunakannya secara gratis, perlu diingat bahwa penerbitan ulang kode ini tunduk pada Tata Tertib kami.
Pernyataan Penyangkalan
Informasi dan publikasi ini tidak dimaksudkan, dan bukan merupakan, saran atau rekomendasi keuangan, investasi, trading, atau jenis lainnya yang diberikan atau didukung oleh TradingView. Baca selengkapnya di Ketentuan Penggunaan.