OPEN-SOURCE SCRIPT
Multi-Timeframe Composite MA
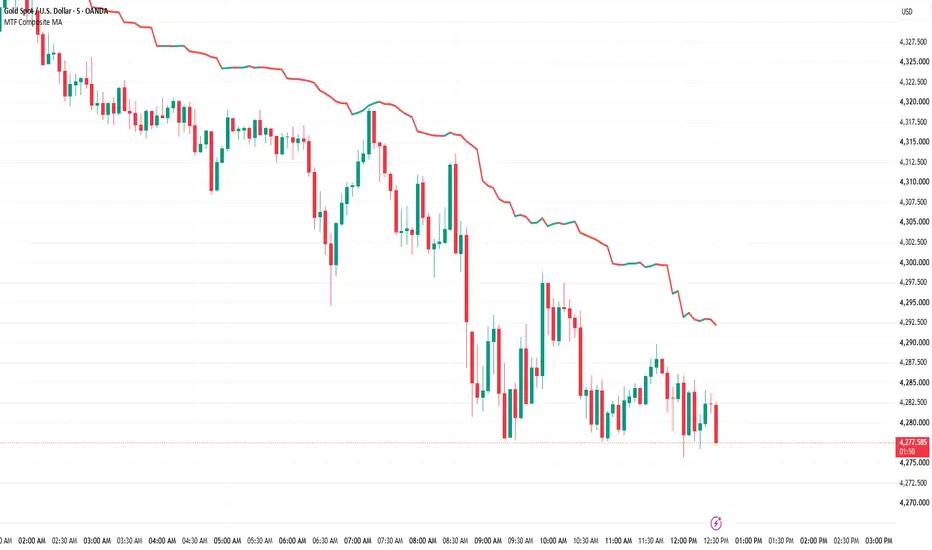
Multi-Timeframe Composite MA
The Multi-Timeframe Composite MA is a trend and confluence tool that combines moving-average values from five fixed timeframes into one composite line.
It calculates the selected moving-average type on:
Each timeframe contributes equally to the composite, with a 20% weight. The five values are averaged into a single line that provides a compact view of multi-timeframe trend direction.
How It Works
The indicator calculates either an SMA or EMA using the selected Moving Average Length. The default length is 7.
The composite value is calculated as:
(4H MA + 1H MA + 30M MA + 15M MA + 5M MA) / 5
The composite line changes color according to its current direction:
The individual timeframe moving averages are also included as optional plots and are hidden by default to keep the chart clean.
How to Use
This indicator is designed primarily as a trend and confluence reference rather than a standalone buy or sell signal.
It is particularly useful on lower timeframes when you want to keep higher-timeframe context visible through a single composite line.
For example, on a lower-timeframe chart, the composite can provide a broader trend reference while price action is analyzed on the current chart timeframe.
Users can select either SMA or EMA and adjust the Moving Average Length according to their analysis.
Lower-Timeframe Use
This indicator is intended to be especially useful on lower chart timeframes, where the fixed 4H, 1H, 30M, 15M, and 5M components can provide multi-timeframe context without requiring several visible moving-average lines.
The indicator is designed to handle different chart timeframes, including situations where one or more of the fixed component timeframes are lower than the current chart timeframe.
Originality and Purpose
The purpose of this script is to provide a single composite reference from five specific market timeframes rather than displaying five separate moving averages as independent signals.
The equal-weighted structure gives each timeframe the same contribution to the composite value. The result is intended to simplify multi-timeframe trend observation and reduce visual clutter.
Important Limitations
This indicator does not generate buy or sell signals and should not be interpreted as a standalone trading system.
The 4H, 1H, 30M, and 15M components can use developing higher-timeframe values while those candles are still forming. Consequently, the composite value and its direction can change before a higher-timeframe candle closes.
The 5M component is included as a fixed part of the composite and is not intended to represent a signal by itself.
As with any moving-average-based tool, the indicator is derived from price data and may react later to sudden market changes.
Use the composite together with your own price-action, market-structure, risk-management, and other analysis rather than treating it as a prediction of future price movement.
The Multi-Timeframe Composite MA is a trend and confluence tool that combines moving-average values from five fixed timeframes into one composite line.
It calculates the selected moving-average type on:
- 4H
- 1H
- 30M
- 15M
- 5M
Each timeframe contributes equally to the composite, with a 20% weight. The five values are averaged into a single line that provides a compact view of multi-timeframe trend direction.
How It Works
The indicator calculates either an SMA or EMA using the selected Moving Average Length. The default length is 7.
The composite value is calculated as:
(4H MA + 1H MA + 30M MA + 15M MA + 5M MA) / 5
The composite line changes color according to its current direction:
- Green = composite is rising
- Red = composite is falling
- Gray = composite is flat
The individual timeframe moving averages are also included as optional plots and are hidden by default to keep the chart clean.
How to Use
This indicator is designed primarily as a trend and confluence reference rather than a standalone buy or sell signal.
It is particularly useful on lower timeframes when you want to keep higher-timeframe context visible through a single composite line.
For example, on a lower-timeframe chart, the composite can provide a broader trend reference while price action is analyzed on the current chart timeframe.
Users can select either SMA or EMA and adjust the Moving Average Length according to their analysis.
Lower-Timeframe Use
This indicator is intended to be especially useful on lower chart timeframes, where the fixed 4H, 1H, 30M, 15M, and 5M components can provide multi-timeframe context without requiring several visible moving-average lines.
The indicator is designed to handle different chart timeframes, including situations where one or more of the fixed component timeframes are lower than the current chart timeframe.
Originality and Purpose
The purpose of this script is to provide a single composite reference from five specific market timeframes rather than displaying five separate moving averages as independent signals.
The equal-weighted structure gives each timeframe the same contribution to the composite value. The result is intended to simplify multi-timeframe trend observation and reduce visual clutter.
Important Limitations
This indicator does not generate buy or sell signals and should not be interpreted as a standalone trading system.
The 4H, 1H, 30M, and 15M components can use developing higher-timeframe values while those candles are still forming. Consequently, the composite value and its direction can change before a higher-timeframe candle closes.
The 5M component is included as a fixed part of the composite and is not intended to represent a signal by itself.
As with any moving-average-based tool, the indicator is derived from price data and may react later to sudden market changes.
Use the composite together with your own price-action, market-structure, risk-management, and other analysis rather than treating it as a prediction of future price movement.
Skrip open-source
Dengan semangat TradingView yang sesungguhnya, pembuat skrip ini telah menjadikannya sebagai sumber terbuka, sehingga para trader dapat meninjau dan memverifikasi fungsinya. Salut untuk penulisnya! Meskipun Anda dapat menggunakannya secara gratis, perlu diingat bahwa penerbitan ulang kode ini tunduk pada Tata Tertib kami.

TradingAnalysis.ai — Analyze Better, Trade Smarter.
Market outlooks, key levels & actionable scenarios for traders.
🔗 tradinganalysis.ai
Market outlooks, key levels & actionable scenarios for traders.
🔗 tradinganalysis.ai
Pernyataan Penyangkalan
Informasi dan publikasi ini tidak dimaksudkan, dan bukan merupakan, saran atau rekomendasi keuangan, investasi, trading, atau jenis lainnya yang diberikan atau didukung oleh TradingView. Baca selengkapnya di Ketentuan Penggunaan.
Skrip open-source
Dengan semangat TradingView yang sesungguhnya, pembuat skrip ini telah menjadikannya sebagai sumber terbuka, sehingga para trader dapat meninjau dan memverifikasi fungsinya. Salut untuk penulisnya! Meskipun Anda dapat menggunakannya secara gratis, perlu diingat bahwa penerbitan ulang kode ini tunduk pada Tata Tertib kami.
TradingAnalysis.ai — Analyze Better, Trade Smarter.
Market outlooks, key levels & actionable scenarios for traders.
🔗 tradinganalysis.ai
Market outlooks, key levels & actionable scenarios for traders.
🔗 tradinganalysis.ai
Pernyataan Penyangkalan
Informasi dan publikasi ini tidak dimaksudkan, dan bukan merupakan, saran atau rekomendasi keuangan, investasi, trading, atau jenis lainnya yang diberikan atau didukung oleh TradingView. Baca selengkapnya di Ketentuan Penggunaan.