52W High & Low | Dashboard
Description
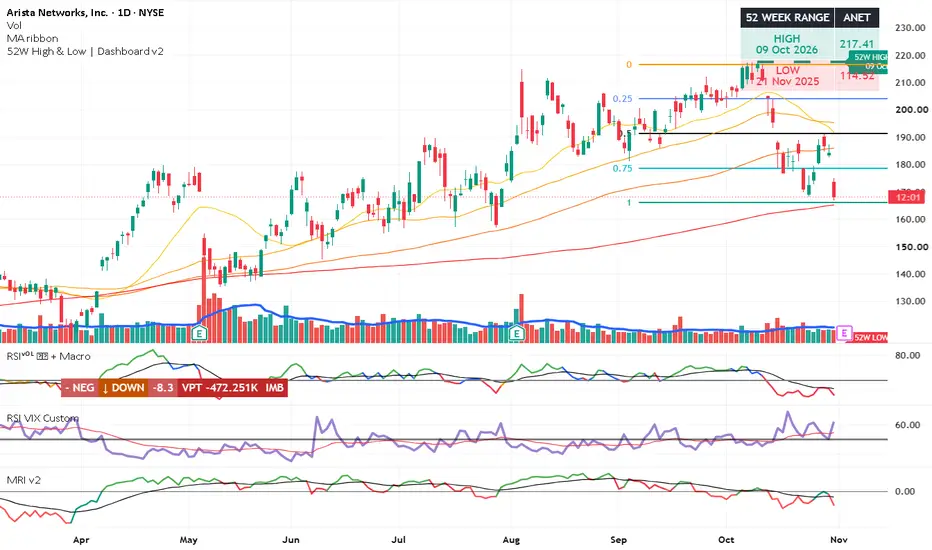
A clean and customizable TradingView indicator that automatically identifies the 52-week high and low, displays their corresponding dates, and plots optional horizontal price levels directly on the chart.
Designed for traders and investors who want to quickly identify key historical price levels without manually drawing support and resistance lines.
Key Features
52-Week High & Low: Automatically calculates the highest and lowest prices over the selected lookback period (default: 252 trading days).
High & Low Dates: Displays the dates when these levels were recorded.
On-Chart Dashboard: Compact table showing the 52-week range, prices, and dates.
Customizable Horizontal Lines: Independently enable or disable high and low levels.
Flexible Line Positioning: Choose between starting at the high/low date, extending across the full chart, or starting from the current candle.
Personalized Appearance: Adjust line colors, thickness, styles (solid, dashed, dotted), and label visibility.
Multi-Timeframe Compatibility: Uses daily price data to calculate levels, allowing consistent reference points across intraday, daily, and weekly charts.
How to Use
The indicator can help traders:
Identify important historical support and resistance zones.
Monitor stocks approaching or breaking their 52-week highs.
Identify stocks trading near their 52-week lows for potential reversal opportunities.
Evaluate price positioning within the annual trading range.
Support breakout, trend-following, and mean-reversion analysis.
Calculation Methodology
The indicator uses the highest daily high and lowest daily low over a configurable lookback period, with 252 trading days as the default approximation of 52 weeks.
Dates correspond to the daily candles on which the respective extremes occurred. Values may change during an active trading session.
Important Notes
Works with stocks, ETFs, indices, and other instruments with sufficient daily historical data.
Historical highs and lows do not guarantee future support or resistance.
The indicator is intended for technical reference and does not generate buy or sell signals.
A simple, flexible tool to keep critical 52-week price levels visible while maintaining a clean trading chart.
A clean and customizable TradingView indicator that automatically identifies the 52-week high and low, displays their corresponding dates, and plots optional horizontal price levels directly on the chart.
Designed for traders and investors who want to quickly identify key historical price levels without manually drawing support and resistance lines.
Key Features
52-Week High & Low: Automatically calculates the highest and lowest prices over the selected lookback period (default: 252 trading days).
High & Low Dates: Displays the dates when these levels were recorded.
On-Chart Dashboard: Compact table showing the 52-week range, prices, and dates.
Customizable Horizontal Lines: Independently enable or disable high and low levels.
Flexible Line Positioning: Choose between starting at the high/low date, extending across the full chart, or starting from the current candle.
Personalized Appearance: Adjust line colors, thickness, styles (solid, dashed, dotted), and label visibility.
Multi-Timeframe Compatibility: Uses daily price data to calculate levels, allowing consistent reference points across intraday, daily, and weekly charts.
How to Use
The indicator can help traders:
Identify important historical support and resistance zones.
Monitor stocks approaching or breaking their 52-week highs.
Identify stocks trading near their 52-week lows for potential reversal opportunities.
Evaluate price positioning within the annual trading range.
Support breakout, trend-following, and mean-reversion analysis.
Calculation Methodology
The indicator uses the highest daily high and lowest daily low over a configurable lookback period, with 252 trading days as the default approximation of 52 weeks.
Dates correspond to the daily candles on which the respective extremes occurred. Values may change during an active trading session.
Important Notes
Works with stocks, ETFs, indices, and other instruments with sufficient daily historical data.
Historical highs and lows do not guarantee future support or resistance.
The indicator is intended for technical reference and does not generate buy or sell signals.
A simple, flexible tool to keep critical 52-week price levels visible while maintaining a clean trading chart.

Pernyataan Penyangkalan
Informasi dan publikasi ini tidak dimaksudkan, dan bukan merupakan, saran atau rekomendasi keuangan, investasi, trading, atau jenis lainnya yang diberikan atau didukung oleh TradingView. Baca selengkapnya di Ketentuan Penggunaan.
Pernyataan Penyangkalan
Informasi dan publikasi ini tidak dimaksudkan, dan bukan merupakan, saran atau rekomendasi keuangan, investasi, trading, atau jenis lainnya yang diberikan atau didukung oleh TradingView. Baca selengkapnya di Ketentuan Penggunaan.