OPEN-SOURCE SCRIPT
SyncroFlow RSI [Trend & Momentum]
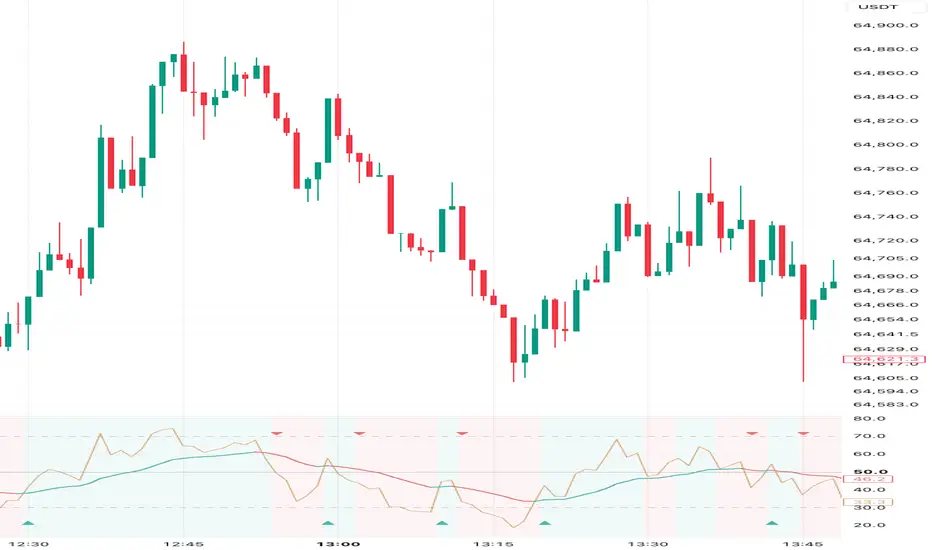
Title: SyncroFlow RSI [Trend & Momentum]
Description:
SyncroFlow RSI is a modern, visually clean indicator designed to help traders objectively identify points of confluence between macro trend direction and short-term momentum.
By combining the structural trend analysis of the SuperTrend with the momentum dynamics of the RSI and its EMA, this tool provides a clear, noise-free visualization of market flow. It is built with a calming, pastel-based color palette to reduce eye strain during long charting sessions, allowing for calm and rational market analysis.
🌟 Core Concepts
Macro Trend (Background Color):
The indicator calculates a short-term SuperTrend (default 10, 1.0) and projects its direction as a subtle background color. A Teal background indicates a bullish overarching trend, while a Rose Red background indicates a bearish trend.
Momentum Flow (RSI & EMA):
Instead of just looking at overbought/oversold levels, this script focuses on the trajectory of the RSI. It plots the RSI alongside a smoothing EMA. The EMA changes color (Teal/Red) based on its slope, giving you an immediate read on whether short-term momentum is accelerating or decelerating.
SyncroFlow Signals (Triangles):
The true edge of this indicator lies in its "Sync" logic. When the overarching trend (SuperTrend Background) and the short-term momentum (RSI's EMA slope) align in the same direction, the indicator plots a triangle signal. This highlights the exact moment the market regains its directional harmony.
⚙️ Key Features
Alternating Signal Filter: To prevent signal spam during choppy consolidations or complex pullbacks, the script includes a strict alternating filter. It will only print a bullish signal if the previous signal was bearish (and vice versa), ensuring you only see the most significant structural shifts.
Calm & Minimalist Aesthetics: Designed with custom Earth and Pastel tones to keep your charts looking professional and easy on the eyes.
Highly Customizable: Everything is neatly grouped in the settings panel. You can easily adjust the RSI length, SuperTrend sensitivity, toggle visuals (hide background or signals), and fully customize the colors/transparency to match your dark or light chart theme.
💡 How to Interpret the Data
Trend Continuation (Pullbacks): During a strong Teal background (Bullish SuperTrend), wait for the RSI's EMA to briefly turn red (pullback), and then look for the Bullish Sync Triangle (alignment) as a potential objective area to rejoin the trend.
Objective Environment Assessment: If the background is Teal but the EMA line is consistently Red, it visually warns you that the macro trend and micro momentum are fighting each other (consolidation/chop).
Disclaimer: This script is designed for educational and objective environmental analysis purposes only. It is not a standalone mechanical trading system. Always use it in conjunction with your own price action analysis and risk management rules.
Description:
SyncroFlow RSI is a modern, visually clean indicator designed to help traders objectively identify points of confluence between macro trend direction and short-term momentum.
By combining the structural trend analysis of the SuperTrend with the momentum dynamics of the RSI and its EMA, this tool provides a clear, noise-free visualization of market flow. It is built with a calming, pastel-based color palette to reduce eye strain during long charting sessions, allowing for calm and rational market analysis.
🌟 Core Concepts
Macro Trend (Background Color):
The indicator calculates a short-term SuperTrend (default 10, 1.0) and projects its direction as a subtle background color. A Teal background indicates a bullish overarching trend, while a Rose Red background indicates a bearish trend.
Momentum Flow (RSI & EMA):
Instead of just looking at overbought/oversold levels, this script focuses on the trajectory of the RSI. It plots the RSI alongside a smoothing EMA. The EMA changes color (Teal/Red) based on its slope, giving you an immediate read on whether short-term momentum is accelerating or decelerating.
SyncroFlow Signals (Triangles):
The true edge of this indicator lies in its "Sync" logic. When the overarching trend (SuperTrend Background) and the short-term momentum (RSI's EMA slope) align in the same direction, the indicator plots a triangle signal. This highlights the exact moment the market regains its directional harmony.
⚙️ Key Features
Alternating Signal Filter: To prevent signal spam during choppy consolidations or complex pullbacks, the script includes a strict alternating filter. It will only print a bullish signal if the previous signal was bearish (and vice versa), ensuring you only see the most significant structural shifts.
Calm & Minimalist Aesthetics: Designed with custom Earth and Pastel tones to keep your charts looking professional and easy on the eyes.
Highly Customizable: Everything is neatly grouped in the settings panel. You can easily adjust the RSI length, SuperTrend sensitivity, toggle visuals (hide background or signals), and fully customize the colors/transparency to match your dark or light chart theme.
💡 How to Interpret the Data
Trend Continuation (Pullbacks): During a strong Teal background (Bullish SuperTrend), wait for the RSI's EMA to briefly turn red (pullback), and then look for the Bullish Sync Triangle (alignment) as a potential objective area to rejoin the trend.
Objective Environment Assessment: If the background is Teal but the EMA line is consistently Red, it visually warns you that the macro trend and micro momentum are fighting each other (consolidation/chop).
Disclaimer: This script is designed for educational and objective environmental analysis purposes only. It is not a standalone mechanical trading system. Always use it in conjunction with your own price action analysis and risk management rules.
Skrip open-source
Dengan semangat TradingView yang sesungguhnya, pembuat skrip ini telah menjadikannya sebagai sumber terbuka, sehingga para trader dapat meninjau dan memverifikasi fungsinya. Salut untuk penulisnya! Meskipun Anda dapat menggunakannya secara gratis, perlu diingat bahwa penerbitan ulang kode ini tunduk pada Tata Tertib kami.

Pernyataan Penyangkalan
Informasi dan publikasi ini tidak dimaksudkan, dan bukan merupakan, saran atau rekomendasi keuangan, investasi, trading, atau jenis lainnya yang diberikan atau didukung oleh TradingView. Baca selengkapnya di Ketentuan Penggunaan.
Skrip open-source
Dengan semangat TradingView yang sesungguhnya, pembuat skrip ini telah menjadikannya sebagai sumber terbuka, sehingga para trader dapat meninjau dan memverifikasi fungsinya. Salut untuk penulisnya! Meskipun Anda dapat menggunakannya secara gratis, perlu diingat bahwa penerbitan ulang kode ini tunduk pada Tata Tertib kami.
Pernyataan Penyangkalan
Informasi dan publikasi ini tidak dimaksudkan, dan bukan merupakan, saran atau rekomendasi keuangan, investasi, trading, atau jenis lainnya yang diberikan atau didukung oleh TradingView. Baca selengkapnya di Ketentuan Penggunaan.