Ultimate CVD Indicator
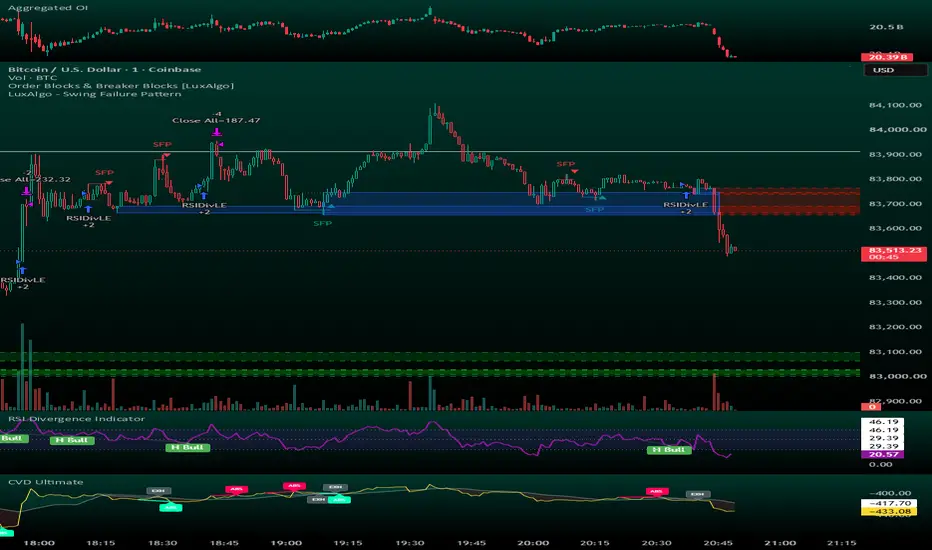
Cumulative Volume Delta indicator that plots CVD and flags potential absorption and exhaustion divergences between price and volume flow.
Core Features
CVD Calculation — Builds a running cumulative delta using a price-positioned volume approximation: ((close - low) - (high - close)) / range × volume.
CVD + MA Overlay — Plots the raw CVD line with an optional moving average and a fill that changes color based on whether CVD is above or below its average.
Pivot-Based Divergence Detection — Identifies pivot highs and lows on the CVD series and compares consecutive pivots (within a configurable bar range) against the corresponding price action.
Four Signal Types:
Bullish Exhaustion (EXH) — Price makes a lower low while CVD makes a higher low.
Bullish Absorption (ABS) — Price makes a higher low while CVD makes a lower low.
Bearish Exhaustion (EXH) — Price makes a higher high while CVD makes a lower high.
Bearish Absorption (ABS) — Price makes a lower high while CVD makes a higher high.
Visual Markers — Draws small labels (“EXH” or “ABS”) and connecting lines on the CVD pane at confirmed pivots. Lines are automatically managed and limited so the chart doesn’t become cluttered.
Customizable Settings — Pivot lookback lengths, minimum/maximum search range between pivots, MA length, and maximum number of lines to retain.
The indicator is designed for the lower pane (non-overlay) and focuses on highlighting possible points of interest where price and cumulative volume delta diverge.
CVD divergences compare how price is moving against how Cumulative Volume Delta is moving. The indicator focuses on four specific types that often appear at potential turning or continuation points.
Bullish Signals (usually near lows)
Bullish Exhaustion
Price makes a lower low, but CVD makes a higher low.
Sellers are pushing price down, yet cumulative buy pressure is improving. This often suggests selling is losing strength and a bounce or reversal may be developing.
Bullish Absorption
Price makes a higher low, but CVD makes a lower low.
Price is holding up (or rising slightly) while CVD is weaker. Buyers are absorbing selling pressure without price falling further. This can indicate accumulation and potential upside continuation.
Bearish Signals (usually near highs)
Bearish Exhaustion
Price makes a higher high, but CVD makes a lower high.
Buyers are pushing price up, yet cumulative sell pressure is increasing (or buy pressure is fading). This often suggests buying is exhausted and a pullback or reversal may be near.
Bearish Absorption
Price makes a lower high, but CVD makes a higher high.
Price is failing to make progress upward while CVD remains strong. Sellers are absorbing buying pressure. This can indicate distribution and potential downside continuation.
Core Features
CVD Calculation — Builds a running cumulative delta using a price-positioned volume approximation: ((close - low) - (high - close)) / range × volume.
CVD + MA Overlay — Plots the raw CVD line with an optional moving average and a fill that changes color based on whether CVD is above or below its average.
Pivot-Based Divergence Detection — Identifies pivot highs and lows on the CVD series and compares consecutive pivots (within a configurable bar range) against the corresponding price action.
Four Signal Types:
Bullish Exhaustion (EXH) — Price makes a lower low while CVD makes a higher low.
Bullish Absorption (ABS) — Price makes a higher low while CVD makes a lower low.
Bearish Exhaustion (EXH) — Price makes a higher high while CVD makes a lower high.
Bearish Absorption (ABS) — Price makes a lower high while CVD makes a higher high.
Visual Markers — Draws small labels (“EXH” or “ABS”) and connecting lines on the CVD pane at confirmed pivots. Lines are automatically managed and limited so the chart doesn’t become cluttered.
Customizable Settings — Pivot lookback lengths, minimum/maximum search range between pivots, MA length, and maximum number of lines to retain.
The indicator is designed for the lower pane (non-overlay) and focuses on highlighting possible points of interest where price and cumulative volume delta diverge.
CVD divergences compare how price is moving against how Cumulative Volume Delta is moving. The indicator focuses on four specific types that often appear at potential turning or continuation points.
Bullish Signals (usually near lows)
Bullish Exhaustion
Price makes a lower low, but CVD makes a higher low.
Sellers are pushing price down, yet cumulative buy pressure is improving. This often suggests selling is losing strength and a bounce or reversal may be developing.
Bullish Absorption
Price makes a higher low, but CVD makes a lower low.
Price is holding up (or rising slightly) while CVD is weaker. Buyers are absorbing selling pressure without price falling further. This can indicate accumulation and potential upside continuation.
Bearish Signals (usually near highs)
Bearish Exhaustion
Price makes a higher high, but CVD makes a lower high.
Buyers are pushing price up, yet cumulative sell pressure is increasing (or buy pressure is fading). This often suggests buying is exhausted and a pullback or reversal may be near.
Bearish Absorption
Price makes a lower high, but CVD makes a higher high.
Price is failing to make progress upward while CVD remains strong. Sellers are absorbing buying pressure. This can indicate distribution and potential downside continuation.

Pernyataan Penyangkalan
Informasi dan publikasi ini tidak dimaksudkan, dan bukan merupakan, saran atau rekomendasi keuangan, investasi, trading, atau jenis lainnya yang diberikan atau didukung oleh TradingView. Baca selengkapnya di Ketentuan Penggunaan.
Pernyataan Penyangkalan
Informasi dan publikasi ini tidak dimaksudkan, dan bukan merupakan, saran atau rekomendasi keuangan, investasi, trading, atau jenis lainnya yang diberikan atau didukung oleh TradingView. Baca selengkapnya di Ketentuan Penggunaan.