OPEN-SOURCE SCRIPT
IND002 - Multi-Timeframe RSI Percentile Map
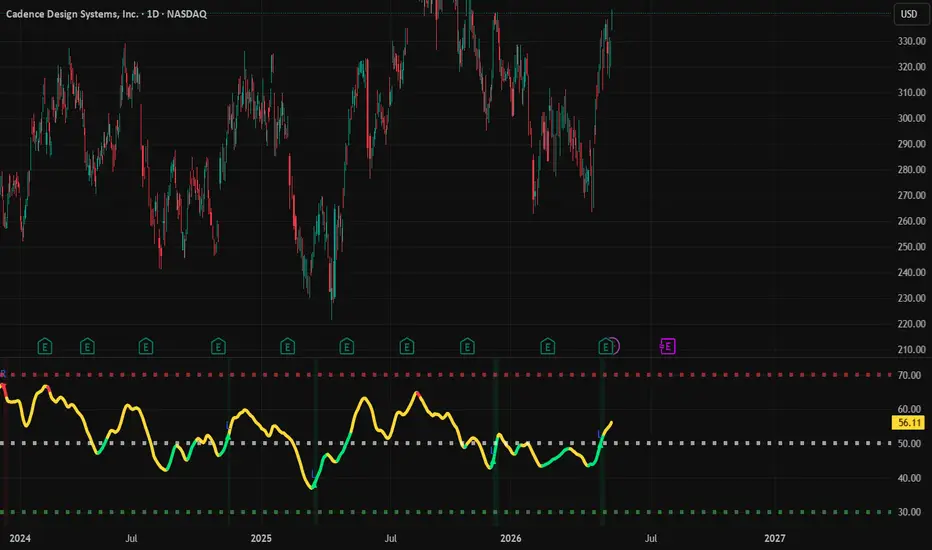
IND002 - Multi-Timeframe RSI Percentile Map shows whether RSI momentum is historically low, historically high, improving, neutral or weakening across several timeframes.
It helps traders use multi-timeframe RSI context before deciding whether a setup is worth considering.
========================================================================
✨ Follow my profile to stay updated on future indicators and improvements
========================================================================
==================================================
WARNING
==================================================
This indicator does not predict the future and does not provide guaranteed entries.
A low percentile can show that momentum is historically depressed, but price can still continue lower. A high percentile can show that momentum is historically stretched, but price can still continue higher.
==================================================
(1) OVERVIEW AND PURPOSE
==================================================
IND002 combines RSI readings from four selected timeframes into one smoother combined RSI line. By default, it uses Monthly, Weekly, Daily, and 4H RSI, but the user can change the timeframes and weights in the settings.
The main purpose is not only to show RSI. The main purpose is to show where the current combined RSI stands compared with its own recent history.
This is done with percentile ranking.
What percentile means
Percentile shows whether the current combined RSI is low, normal, or high compared with its own historical values.
A low percentile is not automatically a buy signal. It means RSI is low compared with its own history. A high percentile is not automatically a sell signal. It means RSI is stretched compared with its own history.
The useful reading comes from combining:
Color meaning
==================================================
(2) HOW TO USE IT PROPERLY
==================================================
The indicator should be used differently depending on the trading style. It is not one fixed entry rule for every trader.
Simple use
Long-term investing use
For long-term investing, give more attention to Monthly, Weekly, and Daily context.
A more useful long-term reading usually appears when:
This does not confirm the exact bottom. It only means multi-timeframe momentum is becoming more constructive compared with its own history.
Swing trading use
For swing trading, a low percentile alone is usually not enough. The trader usually wants evidence that momentum is recovering and that price structure confirms the idea.
A more useful swing reading usually appears when:
For swing trading, Daily and 4H can be weighted more, while Weekly remains useful for context.
Advanced use
Enable the four timeframe RSI curves when you want to compare alignment, divergence, or conflict between timeframes.
Setup markers and alerts
Alerts describe chart conditions only. They are not trade instructions.
==================================================
(3) SETTINGS, SUMMARY AND DISCLAIMER
==================================================
Important settings
This script may receive future refinements if useful improvements are added to the model, settings, or explanation.
If you want to stay updated on future script releases or improvements to this indicator, you can check my profile for new public publications and updates.
Summary
IND002 combines RSI from four timeframes and ranks the result against its own historical range.
It helps users understand whether momentum is 🟩 improving, 🟨 neutral, or 🟥 weakening.
The script is most useful as multi-timeframe momentum context, not as a standalone trading system.
Disclaimer
This script is a public open-source indicator for educational and informational use.
It is not financial advice, investment advice, or a recommendation to buy or sell any asset.
The script identifies momentum and percentile conditions only. It does not guarantee profitable trades, signal accuracy, or future performance.
Users should always apply their own analysis, position sizing, and risk management before making any trading decision.
It helps traders use multi-timeframe RSI context before deciding whether a setup is worth considering.
========================================================================
✨ Follow my profile to stay updated on future indicators and improvements
========================================================================
==================================================
WARNING
==================================================
This indicator does not predict the future and does not provide guaranteed entries.
A low percentile can show that momentum is historically depressed, but price can still continue lower. A high percentile can show that momentum is historically stretched, but price can still continue higher.
Use this as momentum context together with trend, structure, support/resistance, volume, divergence, and risk management.
==================================================
(1) OVERVIEW AND PURPOSE
==================================================
IND002 combines RSI readings from four selected timeframes into one smoother combined RSI line. By default, it uses Monthly, Weekly, Daily, and 4H RSI, but the user can change the timeframes and weights in the settings.
The main purpose is not only to show RSI. The main purpose is to show where the current combined RSI stands compared with its own recent history.
This is done with percentile ranking.
What percentile means
Percentile shows whether the current combined RSI is low, normal, or high compared with its own historical values.
- Percentile 5 - combined RSI is very low compared with recent history.
- Percentile 20 - combined RSI is in a lower historical area.
- Percentile 50 - combined RSI is near its normal middle range.
- Percentile 80 - combined RSI is in a higher historical area.
- Percentile 95 - combined RSI is very stretched compared with recent history.
A low percentile is not automatically a buy signal. It means RSI is low compared with its own history. A high percentile is not automatically a sell signal. It means RSI is stretched compared with its own history.
The useful reading comes from combining:
- percentile level
- RSI direction
- multi-timeframe alignment
- price structure
Color meaning
- 🟩 Green - combined RSI is in a lower percentile area and slope is turning up.
- 🟨 Yellow - momentum is neutral, mixed, or not clear enough.
- 🟥 Red - combined RSI is in a higher percentile area and slope is turning down.
The main idea: do not read RSI only as 30 / 50 / 70. Read where RSI is compared with its own history and whether it is starting to turn.
==================================================
(2) HOW TO USE IT PROPERLY
==================================================
The indicator should be used differently depending on the trading style. It is not one fixed entry rule for every trader.
Simple use
- Check the combined RSI color first.
- 🟩 Green = momentum is recovering from a historically lower area.
- 🟨 Yellow = momentum is neutral or unclear; wait for better context.
- 🟥 Red = momentum is weakening from a historically higher area.
- Confirm the reading with price structure, support/resistance, trend, volume, or divergence.
- Use alerts only as monitoring tools, not as trade instructions.
Long-term investing use
For long-term investing, give more attention to Monthly, Weekly, and Daily context.
A more useful long-term reading usually appears when:
- combined RSI is in a lower percentile area
- the line turns 🟩 green
- higher timeframes stop weakening
- price is near important support or a long-term value area
- market structure starts stabilizing
This does not confirm the exact bottom. It only means multi-timeframe momentum is becoming more constructive compared with its own history.
Swing trading use
For swing trading, a low percentile alone is usually not enough. The trader usually wants evidence that momentum is recovering and that price structure confirms the idea.
A more useful swing reading usually appears when:
- combined RSI was low or below normal
- the line turns 🟩 green
- RSI starts moving back toward the middle area
- Daily and 4H RSI begin to agree
- price confirms with support reaction, reclaim, breakout, or trend continuation
For swing trading, Daily and 4H can be weighted more, while Weekly remains useful for context.
Advanced use
Enable the four timeframe RSI curves when you want to compare alignment, divergence, or conflict between timeframes.
- If price makes a lower low but combined RSI or higher-timeframe RSI improves, this can support a bullish divergence reading.
- If price makes a higher high but RSI weakens, this can support a bearish divergence reading.
- If Monthly, Weekly, Daily, and 4H RSI improve together, momentum confirmation is broader.
- If only 4H improves while Weekly and Monthly remain weak, the move may only be short-term.
Setup markers and alerts
- 🟩 Long-Side Setup - lower percentile area, RSI slope turning up, and optional ADX filter confirmed.
- 🟥 Risk-Off Setup - upper percentile area, RSI slope turning down, and optional ADX filter confirmed.
Alerts describe chart conditions only. They are not trade instructions.
Best use: let IND002 show multi-timeframe momentum context, then confirm with your own price-action method before making a decision.
==================================================
(3) SETTINGS, SUMMARY AND DISCLAIMER
==================================================
Important settings
- RSI period - lower is faster, higher is smoother.
- Timeframes A-D - choose the four RSI timeframes.
- Weights - higher weight gives that timeframe more influence.
- Percentile lookback days - higher is broader context, lower adapts faster.
- Lower threshold - default 20, defines lower-percentile recovery area.
- Upper threshold - default 80, defines upper-percentile risk-off area.
- ADX threshold - filters setup markers by trend strength.
- Show four timeframe RSI curves - helps compare alignment and divergence.
This script may receive future refinements if useful improvements are added to the model, settings, or explanation.
If you want to stay updated on future script releases or improvements to this indicator, you can check my profile for new public publications and updates.
Summary
IND002 combines RSI from four timeframes and ranks the result against its own historical range.
It helps users understand whether momentum is 🟩 improving, 🟨 neutral, or 🟥 weakening.
The script is most useful as multi-timeframe momentum context, not as a standalone trading system.
Disclaimer
This script is a public open-source indicator for educational and informational use.
It is not financial advice, investment advice, or a recommendation to buy or sell any asset.
The script identifies momentum and percentile conditions only. It does not guarantee profitable trades, signal accuracy, or future performance.
Users should always apply their own analysis, position sizing, and risk management before making any trading decision.
Skrip open-source
Dengan semangat TradingView yang sesungguhnya, pembuat skrip ini telah menjadikannya sebagai sumber terbuka, sehingga para trader dapat meninjau dan memverifikasi fungsinya. Salut untuk penulisnya! Meskipun Anda dapat menggunakannya secara gratis, perlu diingat bahwa penerbitan ulang kode ini tunduk pada Tata Tertib kami.

Pernyataan Penyangkalan
Informasi dan publikasi ini tidak dimaksudkan, dan bukan merupakan, saran atau rekomendasi keuangan, investasi, trading, atau jenis lainnya yang diberikan atau didukung oleh TradingView. Baca selengkapnya di Ketentuan Penggunaan.
Skrip open-source
Dengan semangat TradingView yang sesungguhnya, pembuat skrip ini telah menjadikannya sebagai sumber terbuka, sehingga para trader dapat meninjau dan memverifikasi fungsinya. Salut untuk penulisnya! Meskipun Anda dapat menggunakannya secara gratis, perlu diingat bahwa penerbitan ulang kode ini tunduk pada Tata Tertib kami.
Pernyataan Penyangkalan
Informasi dan publikasi ini tidak dimaksudkan, dan bukan merupakan, saran atau rekomendasi keuangan, investasi, trading, atau jenis lainnya yang diberikan atau didukung oleh TradingView. Baca selengkapnya di Ketentuan Penggunaan.