MonthlyPerformanceV2
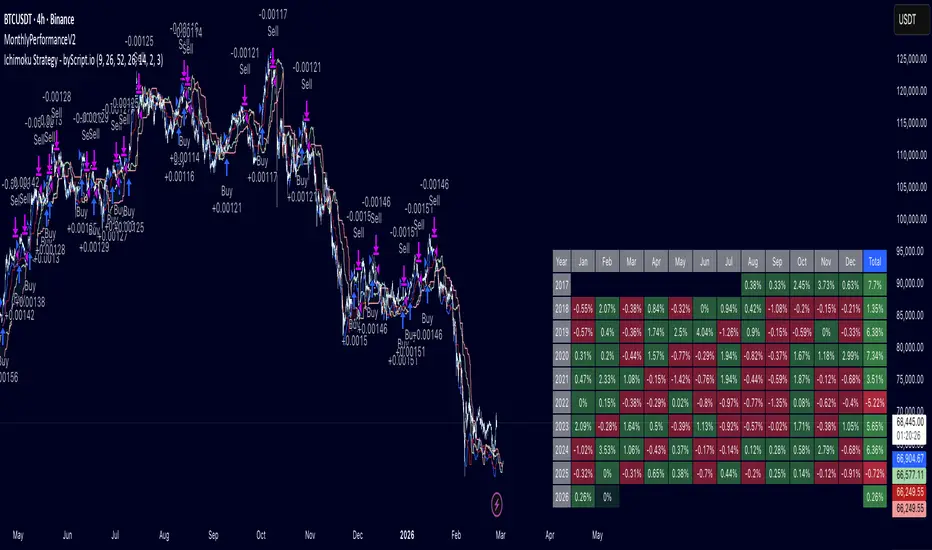
It automatically tracks and displays profit/loss per month and year directly on your chart.
─────────────────────────────────────
🔧 FUNCTION
─────────────────────────────────────
trackAndDraw(initialCapital, showInPercentage)
Parameters:
- initialCapital (float) — The starting capital of your strategy.
Tip: use `strategy.initial_capital` for automatic sync.
- showInPercentage (bool) — Display mode:
`true` → shows monthly result in % (compounding)
`false` → shows monthly result in USD (normalized to initial capital)
─────────────────────────────────────
📊 FEATURES
─────────────────────────────────────
- Compounding % calculation per month and per year
- Dual display mode: percentage or USD equivalent
- Color-coded cells (green / red) for quick visual reading
- Running month tracker (current open month, lighter color)
- Annual total column with compounding yearly return
- Auto-limits display to the 19 most recent years to prevent table overflow
─────────────────────────────────────
🚀 HOW TO USE
─────────────────────────────────────
add this 2 lines code to your script
import edwinardyanto/MonthlyPerformance/1 as mp
mp.trackAndDraw(strategy.initial_capital, true)
─────────────────────────────────────
📌 NOTES
─────────────────────────────────────
- Only compatible with strategy scripts (requires strategy.equity)
- Call trackAndDraw() once, outside any conditional block
- Table is displayed at bottom-right of the chart
- Older years beyond the 19-year limit are excluded from display
but still calculated internally
better visual
Perpustakaan pine
Dengan semangat TradingView yang sesungguhnya, penulis telah menerbitkan kode Pine ini sebagai pustaka sumber terbuka agar programmer Pine lain dari komunitas kami dapat menggunakannya kembali. Salut untuk penulis! Anda dapat menggunakan pustaka ini secara pribadi atau dalam publikasi sumber terbuka lainnya, tetapi penggunaan kembali kode ini dalam publikasi diatur oleh Tata Tertib.

Pernyataan Penyangkalan
Perpustakaan pine
Dengan semangat TradingView yang sesungguhnya, penulis telah menerbitkan kode Pine ini sebagai pustaka sumber terbuka agar programmer Pine lain dari komunitas kami dapat menggunakannya kembali. Salut untuk penulis! Anda dapat menggunakan pustaka ini secara pribadi atau dalam publikasi sumber terbuka lainnya, tetapi penggunaan kembali kode ini dalam publikasi diatur oleh Tata Tertib.