OPEN-SOURCE SCRIPT
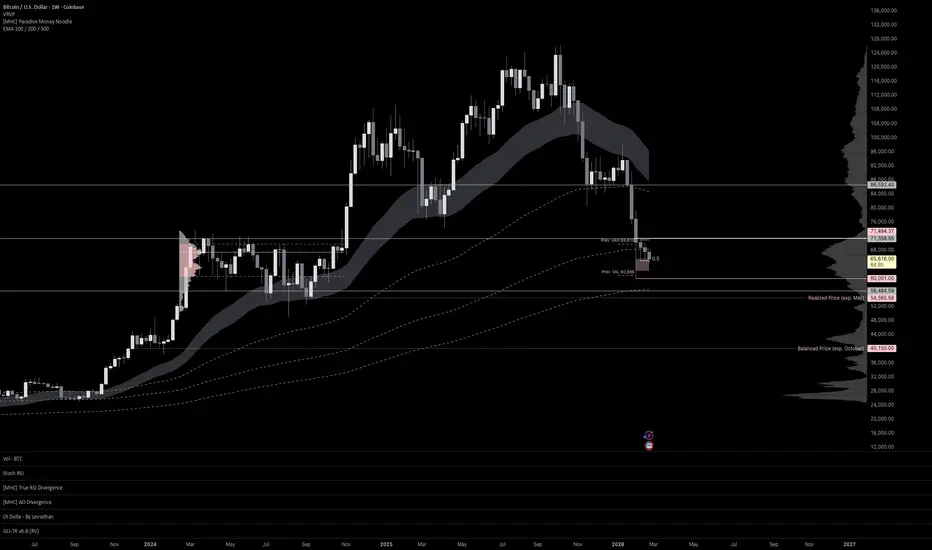
EMA 100 / 200 / 300
Short Description:
A clean overlay of three key Exponential Moving Averages (100, 200, 300) for trend identification and dynamic support/resistance.
Description:
This indicator plots three widely used Exponential Moving Averages directly on your chart:
🟡 EMA 100 – Medium-term trend filter
🔵 EMA 200 – The institutional benchmark for long-term trend direction
🔴 EMA 300 – Deep trend structure and macro support/resistance
How to use:
Price above all three EMAs → Strong bullish structure
Price below all three EMAs → Strong bearish structure
EMA crossovers and convergence/divergence signal potential trend shifts
Use as dynamic support & resistance zones on higher timeframes (4H, Daily, Weekly)
Features:
Fully customizable lengths via input settings
Clean and lightweight – no chart clutter
Works on all assets and timeframes
Best used in combination with volume, order flow, and key level analysis for high-confluence setups.
Skrip open-source
Dengan semangat TradingView yang sesungguhnya, pembuat skrip ini telah menjadikannya sebagai sumber terbuka, sehingga para trader dapat meninjau dan memverifikasi fungsinya. Salut untuk penulisnya! Meskipun Anda dapat menggunakannya secara gratis, perlu diingat bahwa penerbitan ulang kode ini tunduk pada Tata Tertib kami.

Pernyataan Penyangkalan
Informasi dan publikasi ini tidak dimaksudkan, dan bukan merupakan, saran atau rekomendasi keuangan, investasi, trading, atau jenis lainnya yang diberikan atau didukung oleh TradingView. Baca selengkapnya di Ketentuan Penggunaan.
Skrip open-source
Dengan semangat TradingView yang sesungguhnya, pembuat skrip ini telah menjadikannya sebagai sumber terbuka, sehingga para trader dapat meninjau dan memverifikasi fungsinya. Salut untuk penulisnya! Meskipun Anda dapat menggunakannya secara gratis, perlu diingat bahwa penerbitan ulang kode ini tunduk pada Tata Tertib kami.
Pernyataan Penyangkalan
Informasi dan publikasi ini tidak dimaksudkan, dan bukan merupakan, saran atau rekomendasi keuangan, investasi, trading, atau jenis lainnya yang diberikan atau didukung oleh TradingView. Baca selengkapnya di Ketentuan Penggunaan.