OPEN-SOURCE SCRIPT
NSE F&O Option Scanner
How the Scoring Works (0–5 points)
Each condition adds 1 point:
✅ 8 EMA above 20 EMA (trend direction)
✅ OI Proxy confirms direction (Volume + Price interpretation)
✅ Sector index trading above its 20 EMA
✅ RSI not in extreme zone (not overbought for CE / not oversold for PE)
✅ Volume spike ≥ 1.5× the 20-bar average
Score ≥ 4 → High conviction signal → BUY CE or BUY PE label appears on chart
Score 3 → Weak setup — wait for confirmation
Score < 3 → No trade
Dashboard Shows (top-right panel)
🔹 8/20 EMA trend + gap %
🔹 OI Proxy: Long Buildup / Short Buildup / Short Covering / Long Unwinding
🔹 Sector trend vs 20 EMA
🔹 Relative Strength vs sector (20-bar)
🔹 RSI (14) with overbought/oversold alert
🔹 MACD Histogram direction
🔹 Volume — Normal or Spike with multiplier
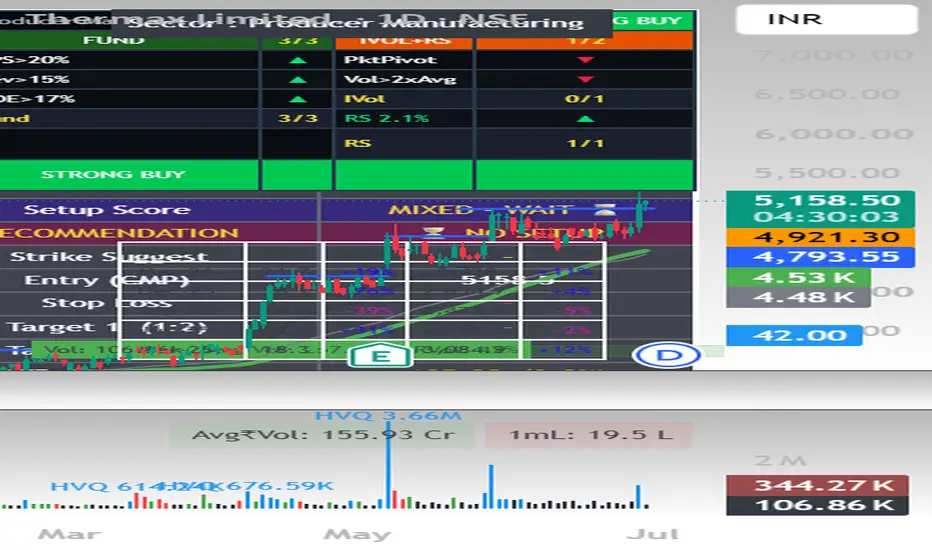
🔹 Setup Score (0–5)
🔹 Recommendation — 🟢 BUY CALL (CE) / 🔴 BUY PUT (PE) / ⏳ NO SETUP
🔹 Auto Strike Suggestion — ATM + 1 OTM (calculated from CMP)
🔹 Entry (CMP), Stop Loss, Target 1 (1:2), Target 2 (1:3)
🔹 ATR with volatility %
🔹 News reminder
How to Use
Add to any NSE F&O stock on Daily or 1H timeframe
Change the Sector Index input to match the stock — NIFTY_BANK, NIFTY_IT, NIFTY_AUTO, NIFTY_PHARMA, NIFTY_FMCG, NIFTY_METAL etc.
Read the dashboard — Score ≥ 4 = high conviction setup
Always verify news and catalyst on NSE website or Screener.in before entering
Set alerts using the 5 built-in alert conditions
Built-in Alerts
🟢 Strong BUY CE — EMA cross + OI + Sector all aligned (score ≥ 4)
🔴 Strong BUY PE — EMA cross + OI + Sector all aligned (score ≥ 4)
📊 EMA Bull Cross — 8 EMA crossed above 20 EMA
📊 EMA Bear Cross — 8 EMA crossed below 20 EMA
📈 Volume Spike in Bull Trend
Note on OI Data
For real open interest data, switch to the futures chart (e.g. NSE:RELIANCE1!). On equity charts this script uses Volume + Price direction as an OI proxy, which closely mirrors standard OI interpretation (Long Buildup, Short Buildup, Short Covering, Long Unwinding).
Settings
All parameters are adjustable — EMA lengths, ATR multiplier, Risk:Reward ratio, OI proxy sensitivity, and sector index. Tooltips explain each input.
⚠️ For educational and analysis purposes only. Not financial advice. Always use proper risk managemen
Each condition adds 1 point:
✅ 8 EMA above 20 EMA (trend direction)
✅ OI Proxy confirms direction (Volume + Price interpretation)
✅ Sector index trading above its 20 EMA
✅ RSI not in extreme zone (not overbought for CE / not oversold for PE)
✅ Volume spike ≥ 1.5× the 20-bar average
Score ≥ 4 → High conviction signal → BUY CE or BUY PE label appears on chart
Score 3 → Weak setup — wait for confirmation
Score < 3 → No trade
Dashboard Shows (top-right panel)
🔹 8/20 EMA trend + gap %
🔹 OI Proxy: Long Buildup / Short Buildup / Short Covering / Long Unwinding
🔹 Sector trend vs 20 EMA
🔹 Relative Strength vs sector (20-bar)
🔹 RSI (14) with overbought/oversold alert
🔹 MACD Histogram direction
🔹 Volume — Normal or Spike with multiplier
🔹 Setup Score (0–5)
🔹 Recommendation — 🟢 BUY CALL (CE) / 🔴 BUY PUT (PE) / ⏳ NO SETUP
🔹 Auto Strike Suggestion — ATM + 1 OTM (calculated from CMP)
🔹 Entry (CMP), Stop Loss, Target 1 (1:2), Target 2 (1:3)
🔹 ATR with volatility %
🔹 News reminder
How to Use
Add to any NSE F&O stock on Daily or 1H timeframe
Change the Sector Index input to match the stock — NIFTY_BANK, NIFTY_IT, NIFTY_AUTO, NIFTY_PHARMA, NIFTY_FMCG, NIFTY_METAL etc.
Read the dashboard — Score ≥ 4 = high conviction setup
Always verify news and catalyst on NSE website or Screener.in before entering
Set alerts using the 5 built-in alert conditions
Built-in Alerts
🟢 Strong BUY CE — EMA cross + OI + Sector all aligned (score ≥ 4)
🔴 Strong BUY PE — EMA cross + OI + Sector all aligned (score ≥ 4)
📊 EMA Bull Cross — 8 EMA crossed above 20 EMA
📊 EMA Bear Cross — 8 EMA crossed below 20 EMA
📈 Volume Spike in Bull Trend
Note on OI Data
For real open interest data, switch to the futures chart (e.g. NSE:RELIANCE1!). On equity charts this script uses Volume + Price direction as an OI proxy, which closely mirrors standard OI interpretation (Long Buildup, Short Buildup, Short Covering, Long Unwinding).
Settings
All parameters are adjustable — EMA lengths, ATR multiplier, Risk:Reward ratio, OI proxy sensitivity, and sector index. Tooltips explain each input.
⚠️ For educational and analysis purposes only. Not financial advice. Always use proper risk managemen
Skrip open-source
Dengan semangat TradingView yang sesungguhnya, pembuat skrip ini telah menjadikannya sebagai sumber terbuka, sehingga para trader dapat meninjau dan memverifikasi fungsinya. Salut untuk penulisnya! Meskipun Anda dapat menggunakannya secara gratis, perlu diingat bahwa penerbitan ulang kode ini tunduk pada Tata Tertib kami.

Pernyataan Penyangkalan
Informasi dan publikasi ini tidak dimaksudkan, dan bukan merupakan, saran atau rekomendasi keuangan, investasi, trading, atau jenis lainnya yang diberikan atau didukung oleh TradingView. Baca selengkapnya di Ketentuan Penggunaan.
Skrip open-source
Dengan semangat TradingView yang sesungguhnya, pembuat skrip ini telah menjadikannya sebagai sumber terbuka, sehingga para trader dapat meninjau dan memverifikasi fungsinya. Salut untuk penulisnya! Meskipun Anda dapat menggunakannya secara gratis, perlu diingat bahwa penerbitan ulang kode ini tunduk pada Tata Tertib kami.
Pernyataan Penyangkalan
Informasi dan publikasi ini tidak dimaksudkan, dan bukan merupakan, saran atau rekomendasi keuangan, investasi, trading, atau jenis lainnya yang diberikan atau didukung oleh TradingView. Baca selengkapnya di Ketentuan Penggunaan.