Tubbsie's Chop Warning Indicator
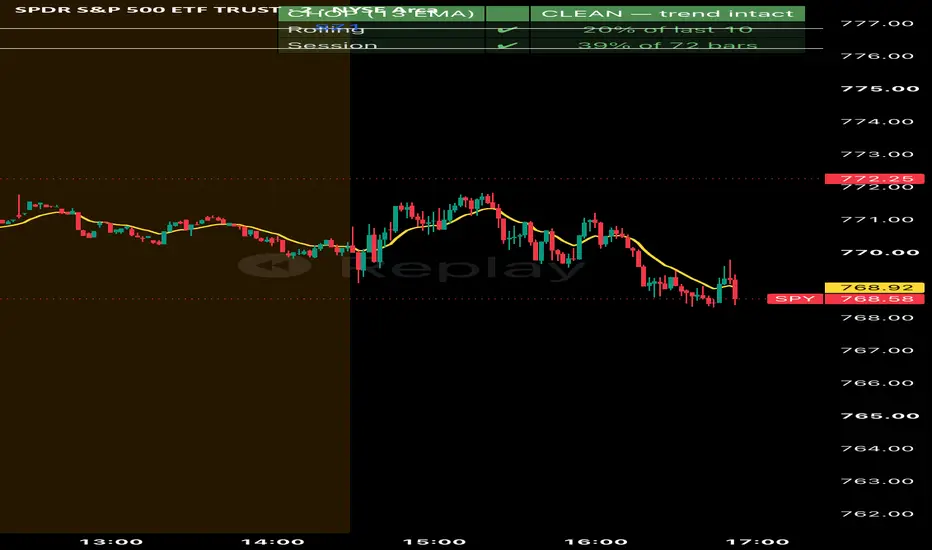
**Chop Warning**
A simple, at-a-glance indicator that tells you whether the market is trending cleanly or chopping sideways around a moving average — the kind of environment where breakouts fail, stops get hunted, and most trend-following setups don't work.
**How it works**
The indicator picks a reference EMA (13 by default) and counts how often each candle's high–low range contains that EMA. When price is trending, most candles sit cleanly above or below the moving average and the count stays low. When price is chopping, the EMA sits inside candle after candle and the count rises.
Two views are reported side by side:
- **Rolling** — the percentage of crosses over the last N candles, showing what's happening right now
- **Session** — the percentage across the whole trading session, showing the character of the day as a whole
Both figures appear in a small on-chart table, colour-coded green (clean), amber (mixed), or red (choppy). A single verdict line at the top summarises the current state in plain English.
**Settings**
Everything is configurable: EMA length, rolling window size, the two thresholds that define "clean" and "choppy", which view drives the warning (rolling, session, or either), the session window and timezone, table position and size, colours, and optional background shading when a warning is active. Alerts fire when chop is detected and when the market cleans up again.
**How to use it**
Works on any market and any timeframe. Add it to your chart alongside your existing setup and treat a red verdict as a filter — a signal to stand aside, reduce size, or wait for the environment to improve before taking a trend-based trade.
A simple, at-a-glance indicator that tells you whether the market is trending cleanly or chopping sideways around a moving average — the kind of environment where breakouts fail, stops get hunted, and most trend-following setups don't work.
**How it works**
The indicator picks a reference EMA (13 by default) and counts how often each candle's high–low range contains that EMA. When price is trending, most candles sit cleanly above or below the moving average and the count stays low. When price is chopping, the EMA sits inside candle after candle and the count rises.
Two views are reported side by side:
- **Rolling** — the percentage of crosses over the last N candles, showing what's happening right now
- **Session** — the percentage across the whole trading session, showing the character of the day as a whole
Both figures appear in a small on-chart table, colour-coded green (clean), amber (mixed), or red (choppy). A single verdict line at the top summarises the current state in plain English.
**Settings**
Everything is configurable: EMA length, rolling window size, the two thresholds that define "clean" and "choppy", which view drives the warning (rolling, session, or either), the session window and timezone, table position and size, colours, and optional background shading when a warning is active. Alerts fire when chop is detected and when the market cleans up again.
**How to use it**
Works on any market and any timeframe. Add it to your chart alongside your existing setup and treat a red verdict as a filter — a signal to stand aside, reduce size, or wait for the environment to improve before taking a trend-based trade.

Pernyataan Penyangkalan
Informasi dan publikasi ini tidak dimaksudkan, dan bukan merupakan, saran atau rekomendasi keuangan, investasi, trading, atau jenis lainnya yang diberikan atau didukung oleh TradingView. Baca selengkapnya di Ketentuan Penggunaan.
Pernyataan Penyangkalan
Informasi dan publikasi ini tidak dimaksudkan, dan bukan merupakan, saran atau rekomendasi keuangan, investasi, trading, atau jenis lainnya yang diberikan atau didukung oleh TradingView. Baca selengkapnya di Ketentuan Penggunaan.