Diupdate
Multi Day Profiles
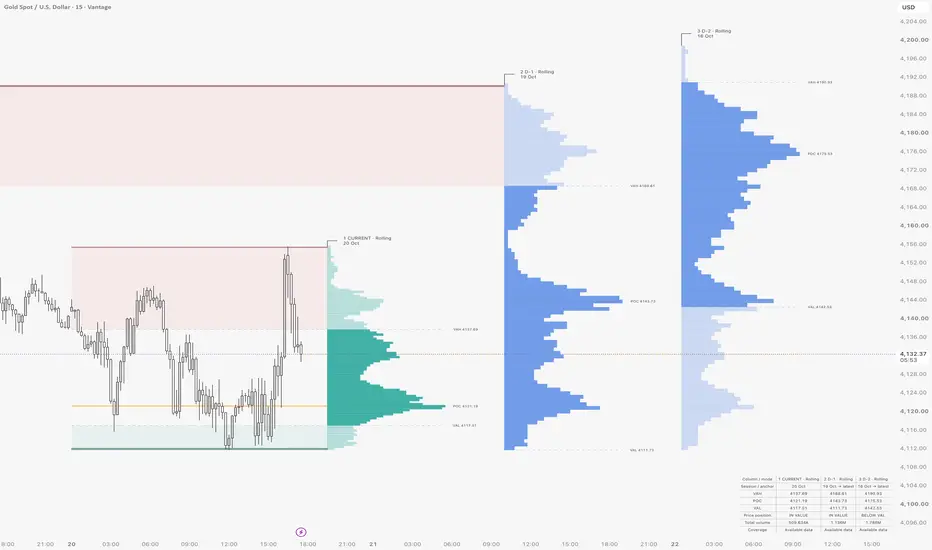
Multi Day Profile (Drizzle_Algo56)
█ OVERVIEW
Multi Day Profile is a configurable volume profile overlay that combines session volume distributions, independent Frozen and Rolling modes, value area analysis, premium and discount zones, and targeted Low Volume Node highlighting.
The indicator displays up to four profiles beside the chart. Each column represents a different trading session anchor, allowing the current session to be compared with previous individual sessions or developing composites.
Every profile calculates its own Point of Control, Value Area High, and Value Area Low. Optional extensions bring these reference levels back into the chart, while premium and discount zones connect the profile structure with the price action that formed it.
Inside each enabled zone, the LVN engine highlights the price row with the lowest estimated traded volume. This creates a more detailed view of participation outside the value area.
Multi Day Profile brings several layers of context together:
• Current session volume structure
• Previous session reference profiles
• Developing composites across multiple sessions
• POC, VAH, and VAL reference levels
• Premium and discount regions outside value
• Low volume areas within those regions
█ PROFILE STRUCTURE
⚪ Four Independent Columns
The profiles are arranged beside the latest chart candle.
Column 1 represents the current or latest available trading session.
Column 2 is anchored to the previous trading session.
Column 3 is anchored two trading sessions back.
Column 4 is anchored three trading sessions back.
The current profile is positioned closest to the chart. Older anchors are placed progressively farther to the right.
Each column has independent controls for its calculation mode, premium zone, discount zone, zone extension, POC extension, and VAH / VAL extensions.
This allows different views to be combined within the same layout. For example, the previous session can remain frozen while an older anchor develops into a broader composite.
⚪ Trading Sessions Rather Than Calendar Gaps
Profiles are built from available session data. A market closure does not create an artificial empty profile.
For markets trading continuously, sessions follow the selected session configuration and the data available on the chart.
The date shown beside each profile identifies its anchor. Column settings follow their relative positions as new trading sessions begin.
█ FROZEN AND ROLLING MODES
⚪ Frozen Mode
Frozen mode isolates the volume belonging to the profile’s anchor session.
After that session finishes, later sessions do not contribute volume to its calculation. Its distribution, POC, value area, premium and discount boundaries, and LVN selection remain based on that session’s data.
This provides a reference for comparing current price action with a completed session.
The current session continues to develop while it is open, including when its column is set to Frozen. Frozen defines which session contributes volume; it is not a manual pause button.
⚪ Rolling Mode
Rolling mode includes all selected session volume from the profile’s anchor through the latest session.
An older anchor therefore becomes a developing composite.
Conceptually:
Pine Script®
Each composite is reconstructed over its own combined price range. Its rows, POC, value area, zones, and LVN highlights can evolve as new data arrives.
Rolling in Multi Day Profile means accumulation from a trading session anchor. It does not represent a fixed trailing number of hours.
⚪ Independent Mode Selection
The columns do not need to share the same mode.
A possible configuration is:
• Current session in Rolling mode
• Previous session in Frozen mode
• Two sessions back in Rolling mode
• Three sessions back in Frozen mode
This places developing session structure, a completed daily reference, and broader composite context beside one another.
█ HOW THE VOLUME PROFILE ENGINE WORKS
⚪ Calculation Timeframe
The engine uses the selected calculation timeframe to obtain source candles.
Available selections are 1, 3, 5, and 15 minutes.
When the selected calculation timeframe is below the chart timeframe, available intrabar candles are requested and processed individually. When the chart timeframe is equal to or smaller than the selected calculation timeframe, chart candles are used directly.
The default calculation timeframe is 1 minute.
⚪ Volume Allocation Across Price Rows
Each source candle contributes volume across the price rows intersecting its high to low range.
The allocation assumes a uniform distribution within that source candle’s range.
Mathematically:
Pine Script®
A candle with no price range assigns its volume to the corresponding row.
This method produces an estimated volume distribution from OHLCV data. It does not reconstruct individual trades or exchange order book activity.
⚪ Tick Aligned Price Rows
Price rows are constructed using whole multiples of the symbol’s minimum tick.
The engine converts the profile range into ticks, determines an appropriate number of ticks per row, and builds the histogram from that grid.
Conceptually:
Pine Script®
The row setting controls the maximum requested resolution. The actual number of rows can be smaller when the profile range contains fewer distinct tick intervals.
Changing the row resolution can change the calculated POC, value area boundaries, and selected LVN row.
⚪ Histogram Width
Every profile is scaled against its own highest volume row.
The largest row receives the full configured profile width. Other rows are displayed proportionally.
Pine Script®
This makes the distribution shape readable across different sessions.
Because profiles are normalized independently, their displayed widths represent relative structure. The summary table provides total volume for comparing overall participation.
█ POC AND VALUE AREA
⚪ Point of Control
The POC is the center price of the row containing the highest estimated volume within the selected profile.
Pine Script®
When multiple rows have exactly the same maximum volume, the calculation selects the lower priced row.
The POC provides a reference for where the greatest estimated participation occurred within that profile.
⚪ Value Area Calculation
The value area begins at the POC and expands through adjacent rows until the selected volume percentage is included.
The default target is 70%.
Pine Script®
The engine compares the next available row above the developing value area with the next available row below it. The row with the larger volume is added first.
When candidate volumes are equal, the row closer to the POC is preferred. If those distances are also equal, the upper row is selected.
Because complete rows are included, the resulting value area can contain more than the requested percentage.
⚪ Value Area High and Value Area Low
VAH marks the upper boundary of the highest included value area row.
VAL marks the lower boundary of the lowest included value area row.
Pine Script®
Together, POC, VAH, and VAL describe the central volume structure of each selected session or composite.
⚪ Optional Chart Extensions
Every column includes separate controls for:
• Extending POC into the chart
• Extending VAH and VAL into the chart
Enabled extensions reach back to the starting session of that profile.
The original level lines remain visible across the profile itself, regardless of whether their chart extensions are enabled.
This allows completed session levels and developing composite levels to be compared directly with chart price action.
█ PREMIUM AND DISCOUNT ZONES
⚪ Premium Zone
The premium zone covers the price interval above VAH, ending at the selected profile’s high.
Pine Script®
⚪ Discount Zone
The discount zone covers the price interval below VAL, ending at the selected profile’s low.
Pine Script®
These definitions are based on the profile’s value area boundaries. They do not use a 50% split of the overall range.
⚪ Zone Placement
Each zone stops at the left edge of its selected profile and extends toward the chart.
When session start extension is enabled, the zone reaches back to that profile’s anchor session.
When it is disabled, the zone covers only the space between the latest chart candle and the profile’s left edge.
The value area between VAL and VAH remains clear of that profile’s premium and discount fills.
A zone appears only when a valid price interval exists outside the value area. If VAH reaches the profile’s high, there is no remaining premium interval to display. The same principle applies when VAL reaches the profile’s low.
⚪ Independent Visibility
Premium and discount can be enabled separately for every column.
This supports a selective layout, such as showing both zones for the previous session while displaying only the premium zone of a broader composite.
In Multi Day Profile, premium and discount describe location relative to the calculated value area. They do not automatically establish overvaluation, undervaluation, or a trade direction.
█ LOW VOLUME NODE HIGHLIGHTING
⚪ Zone Based LVN Detection
The LVN engine searches within each enabled premium or discount zone and selects the eligible profile row containing the smallest positive estimated volume.
Selection is based on volume. The highlighted box’s vertical position represents the price interval of that row.
Conceptually:
Pine Script®
This is a zone minimum definition: one lowest volume row is selected for each enabled zone when an eligible row exists.
⚪ Empty Row Filtering
Empty rows and tiny numerical residue are excluded from the search.
The numerical threshold is relative to the largest row in the profile:
Pine Script®
This keeps untraded gaps and insignificant calculation residue from becoming the selected LVN.
⚪ Tie Handling
When eligible rows have effectively equal volume, the row nearest the value area boundary is preferred.
For the premium zone, the search begins near VAH and progresses upward.
For the discount zone, the search begins near VAL and progresses downward.
⚪ Highlight Boundaries
The selected row is highlighted with a darker rectangular band.
The box is clipped to the premium or discount zone boundaries, including when only part of a row falls inside the zone.
Its horizontal extent follows the corresponding zone setting, and its right edge stops at the profile’s left edge.
The highlight uses a darker version of the parent zone color. Both the color darkening percentage and box transparency are adjustable.
⚪ Frozen and Rolling LVN Behavior
LVN detection uses the same profile data as the histogram.
A completed Frozen profile retains a selection based on its own session.
A Rolling profile can select a different LVN as subsequent session volume changes the composite distribution.
This keeps the histogram, reference levels, zones, and node selection consistent with the chosen calculation mode.
█ SESSION HANDLING
⚪ Chart Session Mode
Chart Session mode follows the exchange trading day structure and session data available on the chart.
This supports symbols whose trading sessions cross calendar midnight.
⚪ Custom Session Mode
Custom Session mode allows specific trading hours, active days, and a timezone to be selected.
Continuous overnight sessions are supported.
Custom session profile dates refer to the session’s starting date.
An IANA timezone such as America/New_York or Europe/Berlin can be used for timezone rules that follow daylight saving changes.
Custom session filtering operates on available chart data. It does not add trading hours excluded from the chart’s data configuration.
█ HOW TO USE
⚪ Compare Current Structure With Previous Value
Begin by comparing current price with the previous session’s POC, VAH, and VAL.
The summary table identifies whether price is inside value, above VAH, below VAL, or outside the profile’s overall range.
This provides a consistent reference for observing how the current session relates to earlier participation.
⚪ Separate Daily References From Composite Context
Use Frozen mode for individual completed session references.
Use Rolling mode when you want to observe the distribution accumulated from an older session anchor through the present.
Combining these views can make differences between a single session and a broader composite easier to inspect.
⚪ Observe Price Outside Value
Enable the premium and discount zones relevant to your analysis.
These regions show where price traded outside the calculated value area while remaining within the selected profile’s range.
Watch how price behaves when revisiting those regions, rather than treating the zone color as an automatic entry instruction.
⚪ Inspect Low Participation Areas
Enable LVN highlighting to isolate the lowest estimated volume row inside each visible zone.
The darker band draws attention to a relatively thin part of that zone’s distribution.
Its usefulness depends on the surrounding price structure, session context, and the quality of the available volume data.
⚪ Keep the Layout Selective
Start with one or two profiles, then enable additional columns and extensions as needed.
Showing every zone and historical level simultaneously can make overlapping structures harder to distinguish.
Profile width, column spacing, label distance, and transparency controls allow the display to be adjusted to the chart.
█ SETTINGS
⚪ Profile Engine
• One to four visible profiles
• Maximum row resolution from 12 to 100
• Adjustable value area percentage
• Calculation timeframe selection
⚪ Independent Column Controls
• Frozen or Rolling mode
• Premium zone visibility
• Discount zone visibility
• Zone extension to the anchor session
• POC chart extension
• VAH / VAL chart extensions
⚪ LVN Controls
• Enable or disable zone based LVN highlighting
• Adjust zone color darkening
• Adjust LVN box transparency
⚪ Session Controls
• Chart Session or Custom Session
• Custom trading hours
• Active session days
• Exchange timezone or a specified IANA timezone
⚪ Layout and Appearance
• Distance from the latest candle
• Profile width and column spacing
• Profile headings and naming distance
• VAH / POC / VAL price labels
• Optional live price line
• Summary table
• Current and previous profile colors
• Reference level colors
• Premium and discount colors
• Black or white label and table text
█ DATA AND CALCULATION NOTES
Multi Day Profile estimates volume at price from source candle data. Its results can differ from other volume profile tools because of differences in data availability, session boundaries, row construction, allocation methods, and value area algorithms.
The meaning of the source volume depends on the selected symbol and its data feed. The calculations use the volume information supplied to the script.
Active session profiles develop as new data arrives. Rolling composites also change when later sessions contribute volume. Changes to settings, available history, or revised source data can alter recalculated results.
An asterisk and a PARTIAL coverage status identify a potentially incomplete profile. The first loaded session is treated conservatively, and missing source coverage can also affect completeness.
Use standard candles or bars on a time based intraday chart of at least 1 minute and below the daily timeframe. Load sufficient session history and leave space beside the latest candle for the selected columns.
The current version is a visual analysis indicator. It does not place trades or include automated entry signals or alert conditions.
█ DEVELOPMENT AND FEEDBACK
Multi Day Profile is under active development.
The default settings provide a starting configuration. Session selection, calculation timeframe, row resolution, and visual density should be reviewed for the instrument and chart being analyzed.
If you notice an unexpected calculation, encounter a display issue, or have an idea for improving the profile framework, please leave a comment or contact me through TradingView.
Including the symbol, chart timeframe, session settings, and a screenshot makes feedback easier to investigate.
█ DISCLAIMER
Multi Day Profile is provided for educational and informational use. Its calculations describe estimated historical and developing volume structure and do not guarantee future price behavior.
Trading involves risk. Evaluate the information independently and make decisions according to your own analysis and risk management.
█ OVERVIEW
Multi Day Profile is a configurable volume profile overlay that combines session volume distributions, independent Frozen and Rolling modes, value area analysis, premium and discount zones, and targeted Low Volume Node highlighting.
The indicator displays up to four profiles beside the chart. Each column represents a different trading session anchor, allowing the current session to be compared with previous individual sessions or developing composites.
Every profile calculates its own Point of Control, Value Area High, and Value Area Low. Optional extensions bring these reference levels back into the chart, while premium and discount zones connect the profile structure with the price action that formed it.
Inside each enabled zone, the LVN engine highlights the price row with the lowest estimated traded volume. This creates a more detailed view of participation outside the value area.
Multi Day Profile brings several layers of context together:
• Current session volume structure
• Previous session reference profiles
• Developing composites across multiple sessions
• POC, VAH, and VAL reference levels
• Premium and discount regions outside value
• Low volume areas within those regions
█ PROFILE STRUCTURE
⚪ Four Independent Columns
The profiles are arranged beside the latest chart candle.
Column 1 represents the current or latest available trading session.
Column 2 is anchored to the previous trading session.
Column 3 is anchored two trading sessions back.
Column 4 is anchored three trading sessions back.
The current profile is positioned closest to the chart. Older anchors are placed progressively farther to the right.
Each column has independent controls for its calculation mode, premium zone, discount zone, zone extension, POC extension, and VAH / VAL extensions.
This allows different views to be combined within the same layout. For example, the previous session can remain frozen while an older anchor develops into a broader composite.
⚪ Trading Sessions Rather Than Calendar Gaps
Profiles are built from available session data. A market closure does not create an artificial empty profile.
For markets trading continuously, sessions follow the selected session configuration and the data available on the chart.
The date shown beside each profile identifies its anchor. Column settings follow their relative positions as new trading sessions begin.
█ FROZEN AND ROLLING MODES
⚪ Frozen Mode
Frozen mode isolates the volume belonging to the profile’s anchor session.
After that session finishes, later sessions do not contribute volume to its calculation. Its distribution, POC, value area, premium and discount boundaries, and LVN selection remain based on that session’s data.
This provides a reference for comparing current price action with a completed session.
The current session continues to develop while it is open, including when its column is set to Frozen. Frozen defines which session contributes volume; it is not a manual pause button.
⚪ Rolling Mode
Rolling mode includes all selected session volume from the profile’s anchor through the latest session.
An older anchor therefore becomes a developing composite.
Conceptually:
Each composite is reconstructed over its own combined price range. Its rows, POC, value area, zones, and LVN highlights can evolve as new data arrives.
Rolling in Multi Day Profile means accumulation from a trading session anchor. It does not represent a fixed trailing number of hours.
⚪ Independent Mode Selection
The columns do not need to share the same mode.
A possible configuration is:
• Current session in Rolling mode
• Previous session in Frozen mode
• Two sessions back in Rolling mode
• Three sessions back in Frozen mode
This places developing session structure, a completed daily reference, and broader composite context beside one another.
█ HOW THE VOLUME PROFILE ENGINE WORKS
⚪ Calculation Timeframe
The engine uses the selected calculation timeframe to obtain source candles.
Available selections are 1, 3, 5, and 15 minutes.
When the selected calculation timeframe is below the chart timeframe, available intrabar candles are requested and processed individually. When the chart timeframe is equal to or smaller than the selected calculation timeframe, chart candles are used directly.
The default calculation timeframe is 1 minute.
⚪ Volume Allocation Across Price Rows
Each source candle contributes volume across the price rows intersecting its high to low range.
The allocation assumes a uniform distribution within that source candle’s range.
Mathematically:
A candle with no price range assigns its volume to the corresponding row.
This method produces an estimated volume distribution from OHLCV data. It does not reconstruct individual trades or exchange order book activity.
⚪ Tick Aligned Price Rows
Price rows are constructed using whole multiples of the symbol’s minimum tick.
The engine converts the profile range into ticks, determines an appropriate number of ticks per row, and builds the histogram from that grid.
Conceptually:
The row setting controls the maximum requested resolution. The actual number of rows can be smaller when the profile range contains fewer distinct tick intervals.
Changing the row resolution can change the calculated POC, value area boundaries, and selected LVN row.
⚪ Histogram Width
Every profile is scaled against its own highest volume row.
The largest row receives the full configured profile width. Other rows are displayed proportionally.
This makes the distribution shape readable across different sessions.
Because profiles are normalized independently, their displayed widths represent relative structure. The summary table provides total volume for comparing overall participation.
█ POC AND VALUE AREA
⚪ Point of Control
The POC is the center price of the row containing the highest estimated volume within the selected profile.
When multiple rows have exactly the same maximum volume, the calculation selects the lower priced row.
The POC provides a reference for where the greatest estimated participation occurred within that profile.
⚪ Value Area Calculation
The value area begins at the POC and expands through adjacent rows until the selected volume percentage is included.
The default target is 70%.
The engine compares the next available row above the developing value area with the next available row below it. The row with the larger volume is added first.
When candidate volumes are equal, the row closer to the POC is preferred. If those distances are also equal, the upper row is selected.
Because complete rows are included, the resulting value area can contain more than the requested percentage.
⚪ Value Area High and Value Area Low
VAH marks the upper boundary of the highest included value area row.
VAL marks the lower boundary of the lowest included value area row.
Together, POC, VAH, and VAL describe the central volume structure of each selected session or composite.
⚪ Optional Chart Extensions
Every column includes separate controls for:
• Extending POC into the chart
• Extending VAH and VAL into the chart
Enabled extensions reach back to the starting session of that profile.
The original level lines remain visible across the profile itself, regardless of whether their chart extensions are enabled.
This allows completed session levels and developing composite levels to be compared directly with chart price action.
█ PREMIUM AND DISCOUNT ZONES
⚪ Premium Zone
The premium zone covers the price interval above VAH, ending at the selected profile’s high.
⚪ Discount Zone
The discount zone covers the price interval below VAL, ending at the selected profile’s low.
These definitions are based on the profile’s value area boundaries. They do not use a 50% split of the overall range.
⚪ Zone Placement
Each zone stops at the left edge of its selected profile and extends toward the chart.
When session start extension is enabled, the zone reaches back to that profile’s anchor session.
When it is disabled, the zone covers only the space between the latest chart candle and the profile’s left edge.
The value area between VAL and VAH remains clear of that profile’s premium and discount fills.
A zone appears only when a valid price interval exists outside the value area. If VAH reaches the profile’s high, there is no remaining premium interval to display. The same principle applies when VAL reaches the profile’s low.
⚪ Independent Visibility
Premium and discount can be enabled separately for every column.
This supports a selective layout, such as showing both zones for the previous session while displaying only the premium zone of a broader composite.
In Multi Day Profile, premium and discount describe location relative to the calculated value area. They do not automatically establish overvaluation, undervaluation, or a trade direction.
█ LOW VOLUME NODE HIGHLIGHTING
⚪ Zone Based LVN Detection
The LVN engine searches within each enabled premium or discount zone and selects the eligible profile row containing the smallest positive estimated volume.
Selection is based on volume. The highlighted box’s vertical position represents the price interval of that row.
Conceptually:
This is a zone minimum definition: one lowest volume row is selected for each enabled zone when an eligible row exists.
⚪ Empty Row Filtering
Empty rows and tiny numerical residue are excluded from the search.
The numerical threshold is relative to the largest row in the profile:
This keeps untraded gaps and insignificant calculation residue from becoming the selected LVN.
⚪ Tie Handling
When eligible rows have effectively equal volume, the row nearest the value area boundary is preferred.
For the premium zone, the search begins near VAH and progresses upward.
For the discount zone, the search begins near VAL and progresses downward.
⚪ Highlight Boundaries
The selected row is highlighted with a darker rectangular band.
The box is clipped to the premium or discount zone boundaries, including when only part of a row falls inside the zone.
Its horizontal extent follows the corresponding zone setting, and its right edge stops at the profile’s left edge.
The highlight uses a darker version of the parent zone color. Both the color darkening percentage and box transparency are adjustable.
⚪ Frozen and Rolling LVN Behavior
LVN detection uses the same profile data as the histogram.
A completed Frozen profile retains a selection based on its own session.
A Rolling profile can select a different LVN as subsequent session volume changes the composite distribution.
This keeps the histogram, reference levels, zones, and node selection consistent with the chosen calculation mode.
█ SESSION HANDLING
⚪ Chart Session Mode
Chart Session mode follows the exchange trading day structure and session data available on the chart.
This supports symbols whose trading sessions cross calendar midnight.
⚪ Custom Session Mode
Custom Session mode allows specific trading hours, active days, and a timezone to be selected.
Continuous overnight sessions are supported.
Custom session profile dates refer to the session’s starting date.
An IANA timezone such as America/New_York or Europe/Berlin can be used for timezone rules that follow daylight saving changes.
Custom session filtering operates on available chart data. It does not add trading hours excluded from the chart’s data configuration.
█ HOW TO USE
⚪ Compare Current Structure With Previous Value
Begin by comparing current price with the previous session’s POC, VAH, and VAL.
The summary table identifies whether price is inside value, above VAH, below VAL, or outside the profile’s overall range.
This provides a consistent reference for observing how the current session relates to earlier participation.
⚪ Separate Daily References From Composite Context
Use Frozen mode for individual completed session references.
Use Rolling mode when you want to observe the distribution accumulated from an older session anchor through the present.
Combining these views can make differences between a single session and a broader composite easier to inspect.
⚪ Observe Price Outside Value
Enable the premium and discount zones relevant to your analysis.
These regions show where price traded outside the calculated value area while remaining within the selected profile’s range.
Watch how price behaves when revisiting those regions, rather than treating the zone color as an automatic entry instruction.
⚪ Inspect Low Participation Areas
Enable LVN highlighting to isolate the lowest estimated volume row inside each visible zone.
The darker band draws attention to a relatively thin part of that zone’s distribution.
Its usefulness depends on the surrounding price structure, session context, and the quality of the available volume data.
⚪ Keep the Layout Selective
Start with one or two profiles, then enable additional columns and extensions as needed.
Showing every zone and historical level simultaneously can make overlapping structures harder to distinguish.
Profile width, column spacing, label distance, and transparency controls allow the display to be adjusted to the chart.
█ SETTINGS
⚪ Profile Engine
• One to four visible profiles
• Maximum row resolution from 12 to 100
• Adjustable value area percentage
• Calculation timeframe selection
⚪ Independent Column Controls
• Frozen or Rolling mode
• Premium zone visibility
• Discount zone visibility
• Zone extension to the anchor session
• POC chart extension
• VAH / VAL chart extensions
⚪ LVN Controls
• Enable or disable zone based LVN highlighting
• Adjust zone color darkening
• Adjust LVN box transparency
⚪ Session Controls
• Chart Session or Custom Session
• Custom trading hours
• Active session days
• Exchange timezone or a specified IANA timezone
⚪ Layout and Appearance
• Distance from the latest candle
• Profile width and column spacing
• Profile headings and naming distance
• VAH / POC / VAL price labels
• Optional live price line
• Summary table
• Current and previous profile colors
• Reference level colors
• Premium and discount colors
• Black or white label and table text
█ DATA AND CALCULATION NOTES
Multi Day Profile estimates volume at price from source candle data. Its results can differ from other volume profile tools because of differences in data availability, session boundaries, row construction, allocation methods, and value area algorithms.
The meaning of the source volume depends on the selected symbol and its data feed. The calculations use the volume information supplied to the script.
Active session profiles develop as new data arrives. Rolling composites also change when later sessions contribute volume. Changes to settings, available history, or revised source data can alter recalculated results.
An asterisk and a PARTIAL coverage status identify a potentially incomplete profile. The first loaded session is treated conservatively, and missing source coverage can also affect completeness.
Use standard candles or bars on a time based intraday chart of at least 1 minute and below the daily timeframe. Load sufficient session history and leave space beside the latest candle for the selected columns.
The current version is a visual analysis indicator. It does not place trades or include automated entry signals or alert conditions.
█ DEVELOPMENT AND FEEDBACK
Multi Day Profile is under active development.
The default settings provide a starting configuration. Session selection, calculation timeframe, row resolution, and visual density should be reviewed for the instrument and chart being analyzed.
If you notice an unexpected calculation, encounter a display issue, or have an idea for improving the profile framework, please leave a comment or contact me through TradingView.
Including the symbol, chart timeframe, session settings, and a screenshot makes feedback easier to investigate.
█ DISCLAIMER
Multi Day Profile is provided for educational and informational use. Its calculations describe estimated historical and developing volume structure and do not guarantee future price behavior.
Trading involves risk. Evaluate the information independently and make decisions according to your own analysis and risk management.
Catatan Rilis
MDP Update — Previous Day & Session Levels• Added Previous Day High (PDH) and Previous Day Low (PDL), based on the previous completed exchange daily candle.
• Added Asia, London, and New York session highs/lows, with optional session open lines.
• Added individual session toggles, custom hours, and time zone settings.
• Added the option to retain completed session levels until the next session begins.
• Added customizable line styles, widths, transparency, and labels.
• Combined labels at identical prices to reduce clutter while retaining every level name.
Settings Improvements
• Reorganized inputs into clear, numbered sections.
• Improved inline alignment without invisible spacing characters.
• Added helpful tooltips and controls that dim when their feature is disabled.
• Added automatic text colors for light and dark charts.
• Added an automatic profile row cap to stay within drawing limits.
PDH/PDL and market session levels operate independently of the profile session settings. Session highs/lows develop while active; a “~” prefix identifies partial session data.

Pernyataan Penyangkalan
Informasi dan publikasi ini tidak dimaksudkan, dan bukan merupakan, saran atau rekomendasi keuangan, investasi, trading, atau jenis lainnya yang diberikan atau didukung oleh TradingView. Baca selengkapnya di Ketentuan Penggunaan.
Pernyataan Penyangkalan
Informasi dan publikasi ini tidak dimaksudkan, dan bukan merupakan, saran atau rekomendasi keuangan, investasi, trading, atau jenis lainnya yang diberikan atau didukung oleh TradingView. Baca selengkapnya di Ketentuan Penggunaan.