OPEN-SOURCE SCRIPT
Stochastic with label OVS/OVB
Stochastic Oscillator
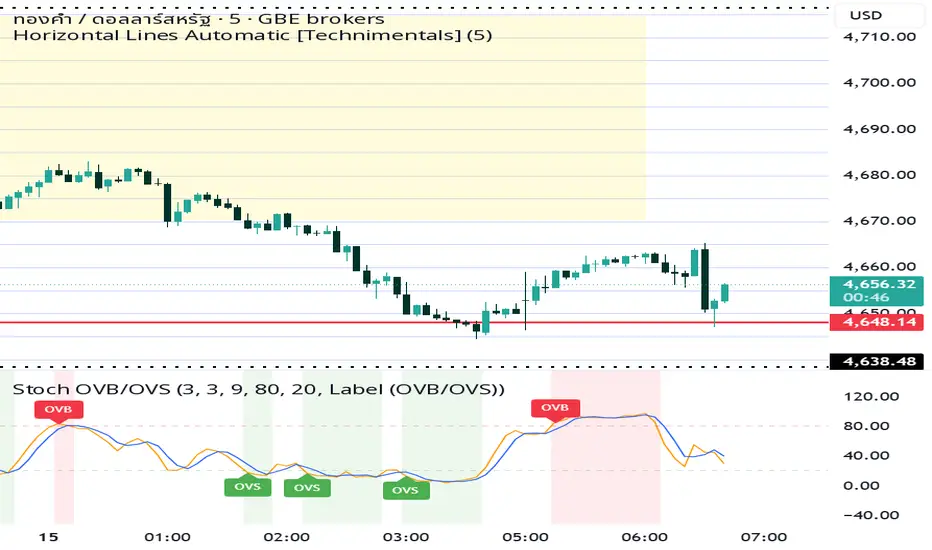
A Stochastic Oscillator indicator with OVB (Overbought) and OVS (Oversold) signal labels displayed beneath the price chart. The indicator uses two momentum lines — a blue %K line and an orange %D signal line — fluctuating between the 20 and 80 levels to identify market momentum and potential reversal zones. Red “OVB” labels appear when the oscillator enters the overbought region above 80, signaling possible bearish exhaustion, while green “OVS” labels appear below 20, indicating potential bullish reversal opportunities. The indicator is designed to help traders detect momentum shifts, trend weakness, and short-term entry or exit signals in fast-moving markets such as XAU/USD.
A Stochastic Oscillator indicator with OVB (Overbought) and OVS (Oversold) signal labels displayed beneath the price chart. The indicator uses two momentum lines — a blue %K line and an orange %D signal line — fluctuating between the 20 and 80 levels to identify market momentum and potential reversal zones. Red “OVB” labels appear when the oscillator enters the overbought region above 80, signaling possible bearish exhaustion, while green “OVS” labels appear below 20, indicating potential bullish reversal opportunities. The indicator is designed to help traders detect momentum shifts, trend weakness, and short-term entry or exit signals in fast-moving markets such as XAU/USD.
Skrip open-source
Dengan semangat TradingView yang sesungguhnya, pembuat skrip ini telah menjadikannya sebagai sumber terbuka, sehingga para trader dapat meninjau dan memverifikasi fungsinya. Salut untuk penulisnya! Meskipun Anda dapat menggunakannya secara gratis, perlu diingat bahwa penerbitan ulang kode ini tunduk pada Tata Tertib kami.

Pernyataan Penyangkalan
Informasi dan publikasi ini tidak dimaksudkan, dan bukan merupakan, saran atau rekomendasi keuangan, investasi, trading, atau jenis lainnya yang diberikan atau didukung oleh TradingView. Baca selengkapnya di Ketentuan Penggunaan.
Skrip open-source
Dengan semangat TradingView yang sesungguhnya, pembuat skrip ini telah menjadikannya sebagai sumber terbuka, sehingga para trader dapat meninjau dan memverifikasi fungsinya. Salut untuk penulisnya! Meskipun Anda dapat menggunakannya secara gratis, perlu diingat bahwa penerbitan ulang kode ini tunduk pada Tata Tertib kami.
Pernyataan Penyangkalan
Informasi dan publikasi ini tidak dimaksudkan, dan bukan merupakan, saran atau rekomendasi keuangan, investasi, trading, atau jenis lainnya yang diberikan atau didukung oleh TradingView. Baca selengkapnya di Ketentuan Penggunaan.