OPEN-SOURCE SCRIPT
nanako_zigzag
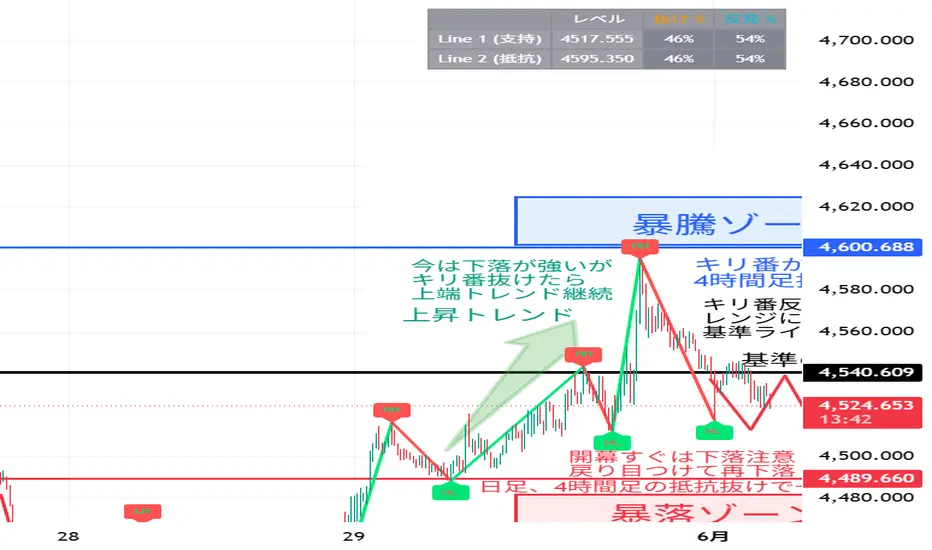
ZigZag++ Bounce / Break Probability is an enhanced ZigZag indicator designed to help traders analyze market structure and evaluate the probability of support and resistance levels breaking or holding.
FEATURES
■ Advanced ZigZag Structure Detection
The indicator automatically detects swing highs and swing lows and draws ZigZag structures in real time.
Each pivot is classified as:
• HH (Higher High)
• HL (Higher Low)
• LH (Lower High)
• LL (Lower Low)
This provides a clear visual representation of trend development and market structure.
■ Automatic Support and Resistance Updates
The two most recent significant pivot levels are automatically converted into support or resistance zones.
Levels update dynamically whenever a new pivot is confirmed, eliminating the need for manual drawing.
■ Breakout and Bounce Probability Engine
The indicator estimates the probability of a level breaking or rejecting by combining multiple technical factors:
• Market structure bias (HH/HL/LH/LL)
• RSI momentum
• EMA21 trend direction
• ATR-based distance scoring
• Volume strength
• Historical touch frequency
• Rejection candle behavior
The result is displayed as a Break Probability and Bounce Probability for each active level.
■ Real-Time Probability Table
A compact table in the top-right corner displays:
• Current level price
• Break probability
• Bounce probability
This allows traders to evaluate key levels instantly without searching through the chart.
■ Clean and Readable Design
The indicator focuses on visual clarity by highlighting only the most relevant information, making it suitable for discretionary traders, breakout traders, and market structure analysis.
USE CASES
• Breakout trading
• Pullback entries
• Support and resistance trading
• Trend continuation analysis
• Market structure confirmation
DISCLAIMER
This indicator does not predict future prices. It is designed to evaluate current market conditions and visualize the relative probability of a breakout or rejection based on multiple technical factors.
ZigZag++ Bounce / Break Probability は、従来の ZigZag インジケーターを拡張し、相場構造の分析とサポート・レジスタンスラインの突破確率を視覚的に判断できるよう設計されたインジケーターです。
【主な機能】
■ ZigZag構造の自動描画
高値・安値を自動検出し、ZigZagラインをリアルタイムで描画します。
■ HH・HL・LH・LLの表示
各ピボットポイントに対して市場構造を自動判定します。
・HH(Higher High)
・HL(Higher Low)
・LH(Lower High)
・LL(Lower Low)
これによりトレンドの方向性を直感的に把握できます。
■ サポート・レジスタンスラインの自動更新
直近2つの重要なピボットを基準に、サポートライン・レジスタンスラインを自動生成します。
ラインは新しいピボット形成時に自動更新されるため、手動でラインを引く必要はありません。
■ ブレイク確率・反発確率の計算
ライン付近では以下の情報を組み合わせて確率を算出します。
・市場構造(HH/HL/LH/LL)
・RSI
・EMA21
・ATRによる距離評価
・出来高
・ライン接触回数
・プライスアクションによる反発判定
これらを総合評価し、現在のラインが突破される可能性と反発する可能性を表示します。
■ 右上の確率テーブル
チャート右上には現在重要な2本のラインについて、
・レベル価格
・ブレイク確率
・反発確率
を一覧表示します。
ラインまで価格が離れていても現在の状況をすぐ確認できます。
■ 視認性を重視した設計
チャート上に必要な情報だけを表示し、分析に集中できるよう設計されています。
【活用例】
・押し目買いポイントの判断
・戻り売りポイントの判断
・ブレイクアウト戦略
・レンジ相場の反発狙い
・相場構造分析
本インジケーターは将来の価格を予測するものではありません。現在の市場構造やテクニカル要素を基に、ブレイクと反発の優位性を視覚化するための補助ツールです。
FEATURES
■ Advanced ZigZag Structure Detection
The indicator automatically detects swing highs and swing lows and draws ZigZag structures in real time.
Each pivot is classified as:
• HH (Higher High)
• HL (Higher Low)
• LH (Lower High)
• LL (Lower Low)
This provides a clear visual representation of trend development and market structure.
■ Automatic Support and Resistance Updates
The two most recent significant pivot levels are automatically converted into support or resistance zones.
Levels update dynamically whenever a new pivot is confirmed, eliminating the need for manual drawing.
■ Breakout and Bounce Probability Engine
The indicator estimates the probability of a level breaking or rejecting by combining multiple technical factors:
• Market structure bias (HH/HL/LH/LL)
• RSI momentum
• EMA21 trend direction
• ATR-based distance scoring
• Volume strength
• Historical touch frequency
• Rejection candle behavior
The result is displayed as a Break Probability and Bounce Probability for each active level.
■ Real-Time Probability Table
A compact table in the top-right corner displays:
• Current level price
• Break probability
• Bounce probability
This allows traders to evaluate key levels instantly without searching through the chart.
■ Clean and Readable Design
The indicator focuses on visual clarity by highlighting only the most relevant information, making it suitable for discretionary traders, breakout traders, and market structure analysis.
USE CASES
• Breakout trading
• Pullback entries
• Support and resistance trading
• Trend continuation analysis
• Market structure confirmation
DISCLAIMER
This indicator does not predict future prices. It is designed to evaluate current market conditions and visualize the relative probability of a breakout or rejection based on multiple technical factors.
ZigZag++ Bounce / Break Probability は、従来の ZigZag インジケーターを拡張し、相場構造の分析とサポート・レジスタンスラインの突破確率を視覚的に判断できるよう設計されたインジケーターです。
【主な機能】
■ ZigZag構造の自動描画
高値・安値を自動検出し、ZigZagラインをリアルタイムで描画します。
■ HH・HL・LH・LLの表示
各ピボットポイントに対して市場構造を自動判定します。
・HH(Higher High)
・HL(Higher Low)
・LH(Lower High)
・LL(Lower Low)
これによりトレンドの方向性を直感的に把握できます。
■ サポート・レジスタンスラインの自動更新
直近2つの重要なピボットを基準に、サポートライン・レジスタンスラインを自動生成します。
ラインは新しいピボット形成時に自動更新されるため、手動でラインを引く必要はありません。
■ ブレイク確率・反発確率の計算
ライン付近では以下の情報を組み合わせて確率を算出します。
・市場構造(HH/HL/LH/LL)
・RSI
・EMA21
・ATRによる距離評価
・出来高
・ライン接触回数
・プライスアクションによる反発判定
これらを総合評価し、現在のラインが突破される可能性と反発する可能性を表示します。
■ 右上の確率テーブル
チャート右上には現在重要な2本のラインについて、
・レベル価格
・ブレイク確率
・反発確率
を一覧表示します。
ラインまで価格が離れていても現在の状況をすぐ確認できます。
■ 視認性を重視した設計
チャート上に必要な情報だけを表示し、分析に集中できるよう設計されています。
【活用例】
・押し目買いポイントの判断
・戻り売りポイントの判断
・ブレイクアウト戦略
・レンジ相場の反発狙い
・相場構造分析
本インジケーターは将来の価格を予測するものではありません。現在の市場構造やテクニカル要素を基に、ブレイクと反発の優位性を視覚化するための補助ツールです。
Skrip open-source
Dengan semangat TradingView yang sesungguhnya, pembuat skrip ini telah menjadikannya sebagai sumber terbuka, sehingga para trader dapat meninjau dan memverifikasi fungsinya. Salut untuk penulisnya! Meskipun Anda dapat menggunakannya secara gratis, perlu diingat bahwa penerbitan ulang kode ini tunduk pada Tata Tertib kami.

Pernyataan Penyangkalan
Informasi dan publikasi ini tidak dimaksudkan, dan bukan merupakan, saran atau rekomendasi keuangan, investasi, trading, atau jenis lainnya yang diberikan atau didukung oleh TradingView. Baca selengkapnya di Ketentuan Penggunaan.
Skrip open-source
Dengan semangat TradingView yang sesungguhnya, pembuat skrip ini telah menjadikannya sebagai sumber terbuka, sehingga para trader dapat meninjau dan memverifikasi fungsinya. Salut untuk penulisnya! Meskipun Anda dapat menggunakannya secara gratis, perlu diingat bahwa penerbitan ulang kode ini tunduk pada Tata Tertib kami.
Pernyataan Penyangkalan
Informasi dan publikasi ini tidak dimaksudkan, dan bukan merupakan, saran atau rekomendasi keuangan, investasi, trading, atau jenis lainnya yang diberikan atau didukung oleh TradingView. Baca selengkapnya di Ketentuan Penggunaan.