OPEN-SOURCE SCRIPT
Diupdate Mansfield RS+ - Relative Strength with Price Confirmation

Combines the Mansfield Relative Strength calculation (credit: stageanalysis) with a price action confirmation overlay (credit: bharatTrader) into a single indicator.
Calculation
The RS line measures daily stock price divided by weekly SPX close, normalized against a 52-week SMA of that ratio. Values above zero indicate outperformance vs. the S&P 500. Values below zero indicate underperformance.
Inputs
Reading the indicator
The zero line changes color based on RS momentum direction — green when RS is accelerating, red when decelerating.
Bubbles appear when price and its 50 SMA agree on direction. Green bubbles indicate price above a rising SMA. Red bubbles indicate price below a falling SMA.
RS above zero with green bubbles: RS and price both confirm, strongest long signal. RS above zero with red bubbles: RS positive but price weakening, use as a caution signal. RS below zero with green bubbles: price leading RS, early watch but not yet actionable. RS below zero with red bubbles: both confirm weakness, avoid.
Alerts included
Credits:
Mansfield RS formula: [url=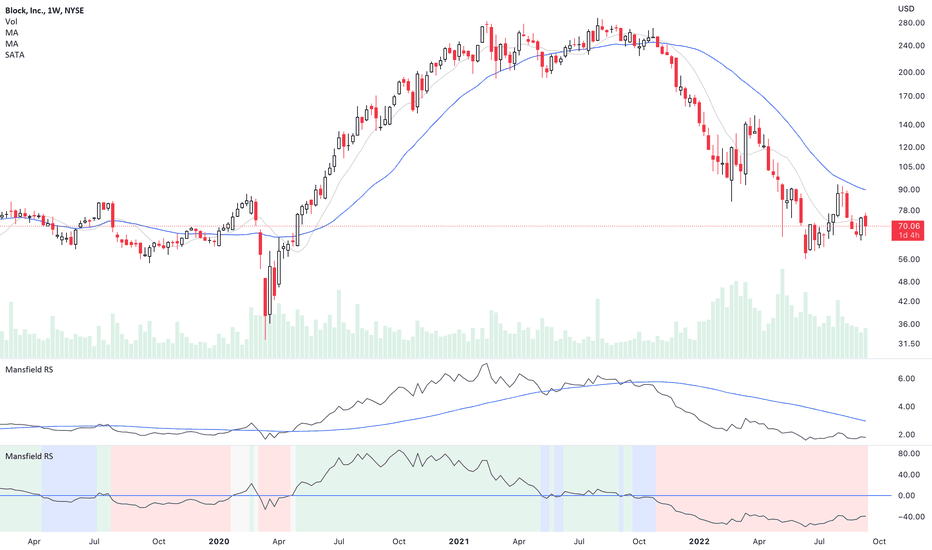
Price confirmation bubble logic: bharatTrader
Calculation
The RS line measures daily stock price divided by weekly SPX close, normalized against a 52-week SMA of that ratio. Values above zero indicate outperformance vs. the S&P 500. Values below zero indicate underperformance.
Inputs
- Symbol: benchmark index (default SP:SPX)
- MA Length: lookback period for the zero line SMA (default 52)
- Price Confirmation Period: SMA length for bubble logic (default 50)
- RS Trend Range: lookback for zero line momentum color (default 5)
- Show Bubbles: toggle price confirmation overlay
- Show Background Colors: toggle Mansfield-style background
Reading the indicator
The zero line changes color based on RS momentum direction — green when RS is accelerating, red when decelerating.
Bubbles appear when price and its 50 SMA agree on direction. Green bubbles indicate price above a rising SMA. Red bubbles indicate price below a falling SMA.
RS above zero with green bubbles: RS and price both confirm, strongest long signal. RS above zero with red bubbles: RS positive but price weakening, use as a caution signal. RS below zero with green bubbles: price leading RS, early watch but not yet actionable. RS below zero with red bubbles: both confirm weakness, avoid.
Alerts included
- RS crossed above/below zero
- RS trend turned bullish/bearish
Credits:
Mansfield RS formula: [url=
Price confirmation bubble logic: bharatTrader
Catatan Rilis
Added configurable value label size and color override option. Reduced bubble size. Removed unused background color inputs.Catatan Rilis
Bug fix to make it work on smaller time frames.Skrip open-source
Dengan semangat TradingView yang sesungguhnya, pembuat skrip ini telah menjadikannya sebagai sumber terbuka, sehingga para trader dapat meninjau dan memverifikasi fungsinya. Salut untuk penulisnya! Meskipun Anda dapat menggunakannya secara gratis, perlu diingat bahwa penerbitan ulang kode ini tunduk pada Tata Tertib kami.

Pernyataan Penyangkalan
Informasi dan publikasi ini tidak dimaksudkan, dan bukan merupakan, saran atau rekomendasi keuangan, investasi, trading, atau jenis lainnya yang diberikan atau didukung oleh TradingView. Baca selengkapnya di Ketentuan Penggunaan.
Skrip open-source
Dengan semangat TradingView yang sesungguhnya, pembuat skrip ini telah menjadikannya sebagai sumber terbuka, sehingga para trader dapat meninjau dan memverifikasi fungsinya. Salut untuk penulisnya! Meskipun Anda dapat menggunakannya secara gratis, perlu diingat bahwa penerbitan ulang kode ini tunduk pada Tata Tertib kami.
Pernyataan Penyangkalan
Informasi dan publikasi ini tidak dimaksudkan, dan bukan merupakan, saran atau rekomendasi keuangan, investasi, trading, atau jenis lainnya yang diberikan atau didukung oleh TradingView. Baca selengkapnya di Ketentuan Penggunaan.