OPEN-SOURCE SCRIPT
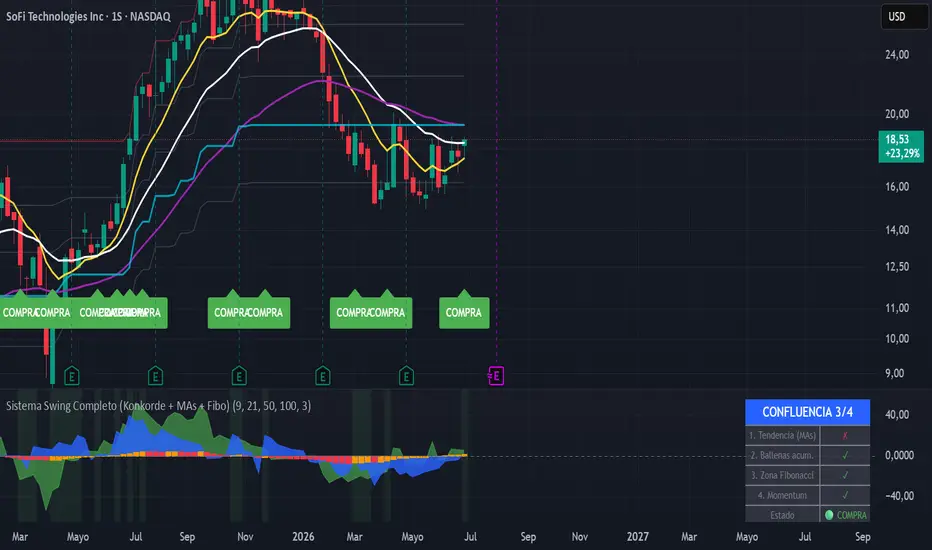
Diupdate Sistema Swing Completo (Konkorde + MAs + Fibo)
// This source code is subject to the terms of the Mozilla Public License 2.0
//version=6
indicator("Sistema Swing Completo (Konkorde + MAs + Fibo)", overlay=false)
// =====================================================================
// 1. KONCORDE (VOLUMEN DE BALLENAS VS MINORISTAS)
// =====================================================================
// Cálculo de PVI (Minoristas) y NVI (Ballenas)
var float pvi = 1000.0
var float nvi = 1000.0
if bar_index > 0
pvi := volume > volume[1] ? pvi[1] + ((close - close[1]) / close[1]) * pvi[1] : pvi[1]
nvi := volume < volume[1] ? nvi[1] + ((close - close[1]) / close[1]) * nvi[1] : nvi[1]
// Oscilación de Minoristas (Manos Débiles)
pvim = ta.ema(pvi, 15)
pvimax = ta.highest(pvim, 90)
pvimin = ta.lowest(pvim, 90)
minoristas = (pvi - pvim) * 100 / math.max(pvimax - pvimin, 1)
// Oscilación de Ballenas (Manos Fuertes)
nvim = ta.ema(nvi, 15)
nvimax = ta.highest(nvim, 90)
nvimin = ta.lowest(nvim, 90)
ballenas = (nvi - nvim) * 100 / math.max(nvimax - nvimin, 1)
plot(minoristas, color=color.new(color.green, 40), style=plot.style_area, title="Volumen Minorista (Verde)")
plot(ballenas, color=color.new(color.blue, 20), style=plot.style_area, title="Volumen Ballenas (Azul)")
// =====================================================================
// 2. INDICADOR DE MOMENTUM (MACD)
// =====================================================================
[macdLine, signalLine, hist] = ta.macd(close, 12, 26, 9)
escala_momentum = 5 // Multiplicador para igualar la escala del Konkorde visualmente
color_hist = hist > hist[1] ? color.new(color.orange, 0) : color.new(color.red, 0)
plot(hist * escala_momentum, color=color_hist, style=plot.style_columns, title="Momentum (Columnas)")
hline(0, color=color.gray, linestyle=hline.style_dashed)
// =====================================================================
// 3. MEDIAS MÓVILES CONFIGURABLES (Proyectadas al gráfico superior)
// =====================================================================
len1 = input.int(9, title="Longitud EMA 1")
len2 = input.int(21, title="Longitud EMA 2")
len3 = input.int(50, title="Longitud EMA 3")
ema1 = ta.ema(close, len1)
ema2 = ta.ema(close, len2)
ema3 = ta.ema(close, len3)
// El uso de force_overlay=true envía estas líneas a las velas japonesas
plot(ema1, color=color.new(color.yellow, 0), linewidth=2, title="EMA Rápida", force_overlay=true)
plot(ema2, color=color.new(color.white, 0), linewidth=2, title="EMA Media", force_overlay=true)
plot(ema3, color=color.new(color.purple, 0), linewidth=2, title="EMA Lenta", force_overlay=true)
// =====================================================================
// 4. RETROCESO DE FIBONACCI (Proyectado al gráfico superior)
// =====================================================================
fibo_lookback = input.int(100, title="Periodo para Fibonacci")
hh = ta.highest(high, fibo_lookback)
ll = ta.lowest(low, fibo_lookback)
diff = hh - ll
plot(hh, color=color.new(color.red, 50), title="100% (Máximo)", force_overlay=true)
plot(hh - diff * 0.236, color=color.new(color.gray, 60), title="76.4%", force_overlay=true)
plot(hh - diff * 0.382, color=color.new(color.gray, 60), title="61.8%", force_overlay=true)
plot(hh - diff * 0.500, color=color.new(color.aqua, 20), linewidth=2, title="50.0% (Equilibrio)", force_overlay=true)
plot(hh - diff * 0.618, color=color.new(color.gray, 60), title="38.2%", force_overlay=true)
plot(ll, color=color.new(color.green, 50), title="0% (Mínimo)", force_overlay=true)
//version=6
indicator("Sistema Swing Completo (Konkorde + MAs + Fibo)", overlay=false)
// =====================================================================
// 1. KONCORDE (VOLUMEN DE BALLENAS VS MINORISTAS)
// =====================================================================
// Cálculo de PVI (Minoristas) y NVI (Ballenas)
var float pvi = 1000.0
var float nvi = 1000.0
if bar_index > 0
pvi := volume > volume[1] ? pvi[1] + ((close - close[1]) / close[1]) * pvi[1] : pvi[1]
nvi := volume < volume[1] ? nvi[1] + ((close - close[1]) / close[1]) * nvi[1] : nvi[1]
// Oscilación de Minoristas (Manos Débiles)
pvim = ta.ema(pvi, 15)
pvimax = ta.highest(pvim, 90)
pvimin = ta.lowest(pvim, 90)
minoristas = (pvi - pvim) * 100 / math.max(pvimax - pvimin, 1)
// Oscilación de Ballenas (Manos Fuertes)
nvim = ta.ema(nvi, 15)
nvimax = ta.highest(nvim, 90)
nvimin = ta.lowest(nvim, 90)
ballenas = (nvi - nvim) * 100 / math.max(nvimax - nvimin, 1)
plot(minoristas, color=color.new(color.green, 40), style=plot.style_area, title="Volumen Minorista (Verde)")
plot(ballenas, color=color.new(color.blue, 20), style=plot.style_area, title="Volumen Ballenas (Azul)")
// =====================================================================
// 2. INDICADOR DE MOMENTUM (MACD)
// =====================================================================
[macdLine, signalLine, hist] = ta.macd(close, 12, 26, 9)
escala_momentum = 5 // Multiplicador para igualar la escala del Konkorde visualmente
color_hist = hist > hist[1] ? color.new(color.orange, 0) : color.new(color.red, 0)
plot(hist * escala_momentum, color=color_hist, style=plot.style_columns, title="Momentum (Columnas)")
hline(0, color=color.gray, linestyle=hline.style_dashed)
// =====================================================================
// 3. MEDIAS MÓVILES CONFIGURABLES (Proyectadas al gráfico superior)
// =====================================================================
len1 = input.int(9, title="Longitud EMA 1")
len2 = input.int(21, title="Longitud EMA 2")
len3 = input.int(50, title="Longitud EMA 3")
ema1 = ta.ema(close, len1)
ema2 = ta.ema(close, len2)
ema3 = ta.ema(close, len3)
// El uso de force_overlay=true envía estas líneas a las velas japonesas
plot(ema1, color=color.new(color.yellow, 0), linewidth=2, title="EMA Rápida", force_overlay=true)
plot(ema2, color=color.new(color.white, 0), linewidth=2, title="EMA Media", force_overlay=true)
plot(ema3, color=color.new(color.purple, 0), linewidth=2, title="EMA Lenta", force_overlay=true)
// =====================================================================
// 4. RETROCESO DE FIBONACCI (Proyectado al gráfico superior)
// =====================================================================
fibo_lookback = input.int(100, title="Periodo para Fibonacci")
hh = ta.highest(high, fibo_lookback)
ll = ta.lowest(low, fibo_lookback)
diff = hh - ll
plot(hh, color=color.new(color.red, 50), title="100% (Máximo)", force_overlay=true)
plot(hh - diff * 0.236, color=color.new(color.gray, 60), title="76.4%", force_overlay=true)
plot(hh - diff * 0.382, color=color.new(color.gray, 60), title="61.8%", force_overlay=true)
plot(hh - diff * 0.500, color=color.new(color.aqua, 20), linewidth=2, title="50.0% (Equilibrio)", force_overlay=true)
plot(hh - diff * 0.618, color=color.new(color.gray, 60), title="38.2%", force_overlay=true)
plot(ll, color=color.new(color.green, 50), title="0% (Mínimo)", force_overlay=true)
Catatan Rilis
LE SUME UNA TABLA DE INFLUENCIA QUE CUANDO 3/4 INDICADORES SE ALINEAN ES SEÑAL DE COMPRACatatan Rilis
AGREGUE LOS PUNTOS DE VENTASkrip open-source
Dengan semangat TradingView yang sesungguhnya, pembuat skrip ini telah menjadikannya sebagai sumber terbuka, sehingga para trader dapat meninjau dan memverifikasi fungsinya. Salut untuk penulisnya! Meskipun Anda dapat menggunakannya secara gratis, perlu diingat bahwa penerbitan ulang kode ini tunduk pada Tata Tertib kami.

Pernyataan Penyangkalan
Informasi dan publikasi ini tidak dimaksudkan, dan bukan merupakan, saran atau rekomendasi keuangan, investasi, trading, atau jenis lainnya yang diberikan atau didukung oleh TradingView. Baca selengkapnya di Ketentuan Penggunaan.
Skrip open-source
Dengan semangat TradingView yang sesungguhnya, pembuat skrip ini telah menjadikannya sebagai sumber terbuka, sehingga para trader dapat meninjau dan memverifikasi fungsinya. Salut untuk penulisnya! Meskipun Anda dapat menggunakannya secara gratis, perlu diingat bahwa penerbitan ulang kode ini tunduk pada Tata Tertib kami.
Pernyataan Penyangkalan
Informasi dan publikasi ini tidak dimaksudkan, dan bukan merupakan, saran atau rekomendasi keuangan, investasi, trading, atau jenis lainnya yang diberikan atau didukung oleh TradingView. Baca selengkapnya di Ketentuan Penggunaan.