EDGE Volume Flow Footprint
EDGE Volume Flow Footprint
A customizable, price-level volume analysis tool built with Pine Script v6.
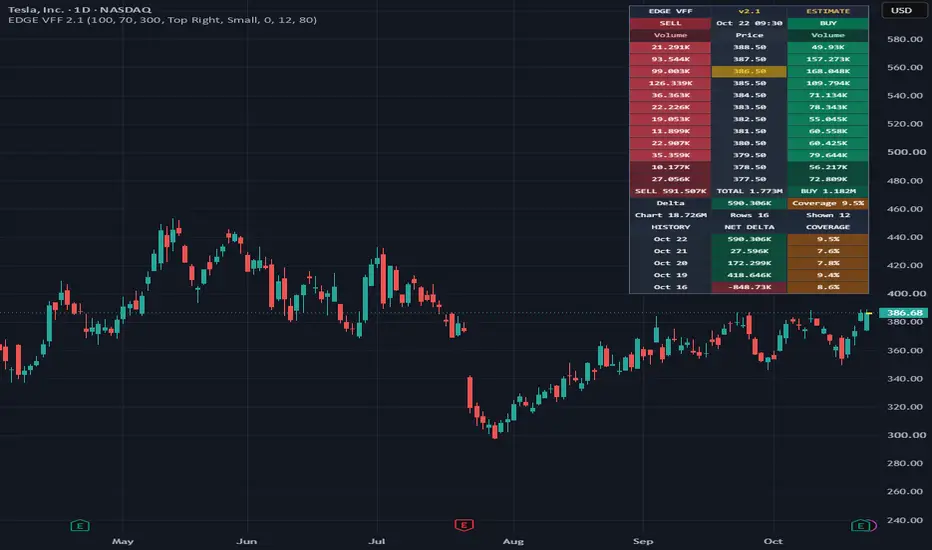
EDGE Volume Flow Footprint presents estimated buying and selling activity in a compact, color-coded ladder without obscuring the underlying price chart. It combines price-level volume, net volume delta, Point of Control (POC), and historical comparisons to help traders better understand volume behavior.
KEY FEATURES
1. Price-Level Volume Analysis
The footprint ladder displays estimated volume at individual price levels:
- RED: Estimated selling volume
- GREEN: Estimated buying volume
- YELLOW: Point of Control (POC), the highest-volume price row
- Value Area: Highlighted rows within the configured percentage of footprint volume
2. Buy, Sell, Total Volume and Delta
For the selected candle, EDGE displays:
- Total estimated selling volume
- Total estimated buying volume
- Total footprint volume
- Net volume delta (Buy minus Sell)
- Reported chart volume
- Footprint coverage percentage
Positive delta indicates more volume classified as buying; negative delta indicates more volume classified as selling.
3. Historical Delta Comparison
Compare the five most recent visible candles with available footprint data.
The historical section displays each candle's estimated net delta and footprint coverage percentage.
Users can inspect an earlier candle through the historical selection setting. Scrolling or zooming the chart changes the available historical range.
4. Customizable Footprint Ladder
The indicator includes configurable options for:
- Nine table positions
- Text size
- Ticks per price row
- Value Area percentage
- Volume imbalance threshold
- Maximum displayed price rows
- POC marker
- Value Area highlighting
- Historical comparison visibility
The ladder shows a configurable selection of price rows around the POC, while candle totals use all available footprint rows.
HOW TO USE
1. Add EDGE Volume Flow Footprint to your chart.
2. Choose a timeframe and configure the ticks per price row.
3. Select your preferred table position and text size.
4. Review buying and selling volume at each price level.
5. Identify the POC and compare volume distribution with price action.
6. Use historical delta readings to evaluate changes in directional pressure.
INTERPRETING VOLUME DELTA
Volume delta provides an estimate of directional trading pressure.
A positive delta during rising prices may support a bullish interpretation, while negative delta during falling prices may support a bearish interpretation.
Divergences between price movement and delta can also be useful. For example, a falling price accompanied by positive delta may warrant investigation for potential selling absorption.
These relationships are not conclusive trading signals and should be evaluated alongside market structure, liquidity, and other technical factors.
IMPORTANT DATA LIMITATIONS
EDGE Volume Flow Footprint uses TradingView's native request.footprint() functionality.
The footprint's buying and selling values are estimates derived from lower-timeframe price behavior. They are not confirmed buyer-initiated and seller-initiated executions across all trading venues.
Footprint volume may differ substantially from standard reported chart volume. The Coverage percentage measures available footprint volume relative to chart volume for the same candle.
Low coverage means the footprint may represent only a limited portion of reported trading activity. Users should not extrapolate its delta to the entire market without additional validation.
The indicator does not import external consolidated trade or quote data.
TradingView Premium or Ultimate is required for the native footprint functionality. Historical data availability varies.
INDEPENDENT INDICATOR
EDGE Volume Flow Footprint is an independent price-and-volume research tool. It does not depend on EDGE GLI or any other proprietary indicator.
Developed using Pine Script v6.
For educational and analytical purposes only. This indicator does not provide guaranteed trading signals or financial advice.
A customizable, price-level volume analysis tool built with Pine Script v6.
EDGE Volume Flow Footprint presents estimated buying and selling activity in a compact, color-coded ladder without obscuring the underlying price chart. It combines price-level volume, net volume delta, Point of Control (POC), and historical comparisons to help traders better understand volume behavior.
KEY FEATURES
1. Price-Level Volume Analysis
The footprint ladder displays estimated volume at individual price levels:
- RED: Estimated selling volume
- GREEN: Estimated buying volume
- YELLOW: Point of Control (POC), the highest-volume price row
- Value Area: Highlighted rows within the configured percentage of footprint volume
2. Buy, Sell, Total Volume and Delta
For the selected candle, EDGE displays:
- Total estimated selling volume
- Total estimated buying volume
- Total footprint volume
- Net volume delta (Buy minus Sell)
- Reported chart volume
- Footprint coverage percentage
Positive delta indicates more volume classified as buying; negative delta indicates more volume classified as selling.
3. Historical Delta Comparison
Compare the five most recent visible candles with available footprint data.
The historical section displays each candle's estimated net delta and footprint coverage percentage.
Users can inspect an earlier candle through the historical selection setting. Scrolling or zooming the chart changes the available historical range.
4. Customizable Footprint Ladder
The indicator includes configurable options for:
- Nine table positions
- Text size
- Ticks per price row
- Value Area percentage
- Volume imbalance threshold
- Maximum displayed price rows
- POC marker
- Value Area highlighting
- Historical comparison visibility
The ladder shows a configurable selection of price rows around the POC, while candle totals use all available footprint rows.
HOW TO USE
1. Add EDGE Volume Flow Footprint to your chart.
2. Choose a timeframe and configure the ticks per price row.
3. Select your preferred table position and text size.
4. Review buying and selling volume at each price level.
5. Identify the POC and compare volume distribution with price action.
6. Use historical delta readings to evaluate changes in directional pressure.
INTERPRETING VOLUME DELTA
Volume delta provides an estimate of directional trading pressure.
A positive delta during rising prices may support a bullish interpretation, while negative delta during falling prices may support a bearish interpretation.
Divergences between price movement and delta can also be useful. For example, a falling price accompanied by positive delta may warrant investigation for potential selling absorption.
These relationships are not conclusive trading signals and should be evaluated alongside market structure, liquidity, and other technical factors.
IMPORTANT DATA LIMITATIONS
EDGE Volume Flow Footprint uses TradingView's native request.footprint() functionality.
The footprint's buying and selling values are estimates derived from lower-timeframe price behavior. They are not confirmed buyer-initiated and seller-initiated executions across all trading venues.
Footprint volume may differ substantially from standard reported chart volume. The Coverage percentage measures available footprint volume relative to chart volume for the same candle.
Low coverage means the footprint may represent only a limited portion of reported trading activity. Users should not extrapolate its delta to the entire market without additional validation.
The indicator does not import external consolidated trade or quote data.
TradingView Premium or Ultimate is required for the native footprint functionality. Historical data availability varies.
INDEPENDENT INDICATOR
EDGE Volume Flow Footprint is an independent price-and-volume research tool. It does not depend on EDGE GLI or any other proprietary indicator.
Developed using Pine Script v6.
For educational and analytical purposes only. This indicator does not provide guaranteed trading signals or financial advice.

Pernyataan Penyangkalan
Informasi dan publikasi ini tidak dimaksudkan, dan bukan merupakan, saran atau rekomendasi keuangan, investasi, trading, atau jenis lainnya yang diberikan atau didukung oleh TradingView. Baca selengkapnya di Ketentuan Penggunaan.
Pernyataan Penyangkalan
Informasi dan publikasi ini tidak dimaksudkan, dan bukan merupakan, saran atau rekomendasi keuangan, investasi, trading, atau jenis lainnya yang diberikan atau didukung oleh TradingView. Baca selengkapnya di Ketentuan Penggunaan.