OPEN-SOURCE SCRIPT
Vanta Delta Cartography [JOAT]
Vanta Delta Cartography [JOAT]
Introduction
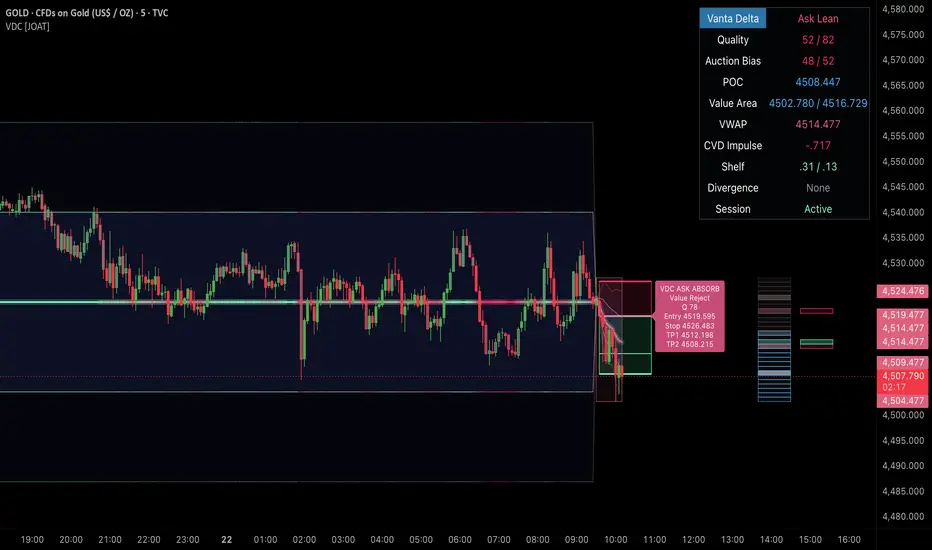
Vanta Delta Cartography is an open-source liquidity and auction-mapping indicator. It combines session VWAP bands, a developing volume profile, POC/value-area/VWMP references, estimated CVD impulse, pivot-confirmed divergence, absorption scoring, naked POC memory, and compact execution plans.
The goal is to show where the active session is accepting value, where pressure is imbalanced, and where a confirmed bid-side or ask-side plan appears.

Core Concepts
1. Manual Session VWAP
The script calculates session VWAP from cumulative price-volume and volume during the configured active session. Weighted deviation bands create inner and outer auction zones around VWAP.
2. Developing Volume Profile
The active range is divided into rows. The script estimates total volume, buy pressure, and sell pressure inside each row, then derives POC, value area high, value area low, VWMP, and imbalance shelves.
3. Estimated CVD Impulse
CVD is estimated from candle-derived delta. Fast and slow CVD lines create impulse context, while pivot-confirmed divergence identifies disagreement between price and participation.
4. Naked POC Memory
Prior session POC levels can be stored until price revisits them. This gives the chart a memory of unfinished auction references.
5. Auction Quality Gate
Long and short plans require location, delta, quality score, and a supporting event such as POC reclaim, value-area reaction, divergence, or shelf pressure.
Features
Input Parameters
Core and Bands: Active Session, Session Bars Used, Profile Rows, Value Area, Show VWAP Bands, Inner Sigma, Outer Sigma.
Signals and Risk: Signal Zones, Pivot Left, Pivot Right, Delta Impulse Threshold, Auction Quality Gate, Signal Projection Bars, Signal Cooldown Bars, ATR Stop, ATR Target.
Visuals: Right Profile Heatmap, POC / VA / VWMP Lines, Naked POC Line, Session Auction Frame, Right Imbalance Shelves, Liquidity Candle Color, Dashboard.
How to Use This Indicator
Step 1: Read the session auction
Use VWAP, value area, and POC to determine whether price is accepting above control, below control, or rotating around value.
Step 2: Check pressure shelves
Imbalance shelves show where estimated participation is concentrated. These areas can act as reaction context.
Step 3: Watch CVD impulse and divergence
Strong CVD impulse supports continuation. Divergence warns that price and participation are not confirming each other.
Indicator Limitations
Originality Statement
Vanta Delta Cartography is original in its combined session VWAP, developing profile, pressure heatmap, estimated CVD impulse, pivot divergence, naked POC memory, imbalance shelves, and confirmed execution-plan logic. Each layer supports the same auction question: where is value, where is pressure, and where has participation failed or accepted?
Disclaimer
This script is provided for educational and informational purposes only. It is not financial advice or a recommendation to buy or sell. Auction and delta estimates can be inaccurate, especially on symbols with limited volume data. Use independent analysis and risk management.
Made with passion by jackofalltrades
Introduction
Vanta Delta Cartography is an open-source liquidity and auction-mapping indicator. It combines session VWAP bands, a developing volume profile, POC/value-area/VWMP references, estimated CVD impulse, pivot-confirmed divergence, absorption scoring, naked POC memory, and compact execution plans.
The goal is to show where the active session is accepting value, where pressure is imbalanced, and where a confirmed bid-side or ask-side plan appears.
Core Concepts
1. Manual Session VWAP
The script calculates session VWAP from cumulative price-volume and volume during the configured active session. Weighted deviation bands create inner and outer auction zones around VWAP.
2. Developing Volume Profile
The active range is divided into rows. The script estimates total volume, buy pressure, and sell pressure inside each row, then derives POC, value area high, value area low, VWMP, and imbalance shelves.
3. Estimated CVD Impulse
CVD is estimated from candle-derived delta. Fast and slow CVD lines create impulse context, while pivot-confirmed divergence identifies disagreement between price and participation.
4. Naked POC Memory
Prior session POC levels can be stored until price revisits them. This gives the chart a memory of unfinished auction references.
5. Auction Quality Gate
Long and short plans require location, delta, quality score, and a supporting event such as POC reclaim, value-area reaction, divergence, or shelf pressure.
Features
- Session VWAP with deviation bands: Shows the active auction mean and volatility envelope.
- Developing profile: Tracks POC, VAH, VAL, VWMP, and row pressure.
- Right-side heatmap: Displays volume and pressure intensity by price row.
- Imbalance shelves: Highlights areas where buy or sell pressure dominates.
- Estimated CVD impulse: Measures participation direction from candle and volume data.
- Pivot-confirmed divergence: Marks bullish or bearish CVD disagreement.
- Naked POC memory: Stores prior POC references until revisited.
- Execution plans: Draws compact entry, stop, TP1, and TP2 zones for confirmed absorption states.
- Candle coloring: Bars can reflect liquidity pressure.
- Dashboard and alerts: Includes auction state, POC, value area, VWAP, CVD impulse, divergence, naked POC, and session state.
Input Parameters
Core and Bands: Active Session, Session Bars Used, Profile Rows, Value Area, Show VWAP Bands, Inner Sigma, Outer Sigma.
Signals and Risk: Signal Zones, Pivot Left, Pivot Right, Delta Impulse Threshold, Auction Quality Gate, Signal Projection Bars, Signal Cooldown Bars, ATR Stop, ATR Target.
Visuals: Right Profile Heatmap, POC / VA / VWMP Lines, Naked POC Line, Session Auction Frame, Right Imbalance Shelves, Liquidity Candle Color, Dashboard.
How to Use This Indicator
Step 1: Read the session auction
Use VWAP, value area, and POC to determine whether price is accepting above control, below control, or rotating around value.
Step 2: Check pressure shelves
Imbalance shelves show where estimated participation is concentrated. These areas can act as reaction context.
Step 3: Watch CVD impulse and divergence
Strong CVD impulse supports continuation. Divergence warns that price and participation are not confirming each other.
Indicator Limitations
- CVD and pressure are estimated from candles and volume, not true exchange delta.
- Volume profile rows are approximations based on chart data and selected lookback.
- Session behavior depends on the selected session template.
- Divergence uses pivot confirmation and can appear after the pivot candle.
Originality Statement
Vanta Delta Cartography is original in its combined session VWAP, developing profile, pressure heatmap, estimated CVD impulse, pivot divergence, naked POC memory, imbalance shelves, and confirmed execution-plan logic. Each layer supports the same auction question: where is value, where is pressure, and where has participation failed or accepted?
Disclaimer
This script is provided for educational and informational purposes only. It is not financial advice or a recommendation to buy or sell. Auction and delta estimates can be inaccurate, especially on symbols with limited volume data. Use independent analysis and risk management.
Made with passion by jackofalltrades
Skrip open-source
Dengan semangat TradingView yang sesungguhnya, pembuat skrip ini telah menjadikannya sebagai sumber terbuka, sehingga para trader dapat meninjau dan memverifikasi fungsinya. Salut untuk penulisnya! Meskipun Anda dapat menggunakannya secara gratis, perlu diingat bahwa penerbitan ulang kode ini tunduk pada Tata Tertib kami.

The Institutional Grade Trading Ecosystem, Built to win trades 📈
Get Access 👇
jackofalltrades.vip 🌐
t.me/jackofalltradesvip 🃏
Get Access 👇
jackofalltrades.vip 🌐
t.me/jackofalltradesvip 🃏
Pernyataan Penyangkalan
Informasi dan publikasi ini tidak dimaksudkan, dan bukan merupakan, saran atau rekomendasi keuangan, investasi, trading, atau jenis lainnya yang diberikan atau didukung oleh TradingView. Baca selengkapnya di Ketentuan Penggunaan.
Skrip open-source
Dengan semangat TradingView yang sesungguhnya, pembuat skrip ini telah menjadikannya sebagai sumber terbuka, sehingga para trader dapat meninjau dan memverifikasi fungsinya. Salut untuk penulisnya! Meskipun Anda dapat menggunakannya secara gratis, perlu diingat bahwa penerbitan ulang kode ini tunduk pada Tata Tertib kami.
The Institutional Grade Trading Ecosystem, Built to win trades 📈
Get Access 👇
jackofalltrades.vip 🌐
t.me/jackofalltradesvip 🃏
Get Access 👇
jackofalltrades.vip 🌐
t.me/jackofalltradesvip 🃏
Pernyataan Penyangkalan
Informasi dan publikasi ini tidak dimaksudkan, dan bukan merupakan, saran atau rekomendasi keuangan, investasi, trading, atau jenis lainnya yang diberikan atau didukung oleh TradingView. Baca selengkapnya di Ketentuan Penggunaan.