OPEN-SOURCE SCRIPT
AetherEdge - Spectral Cycle Engine
🖊️ Overview
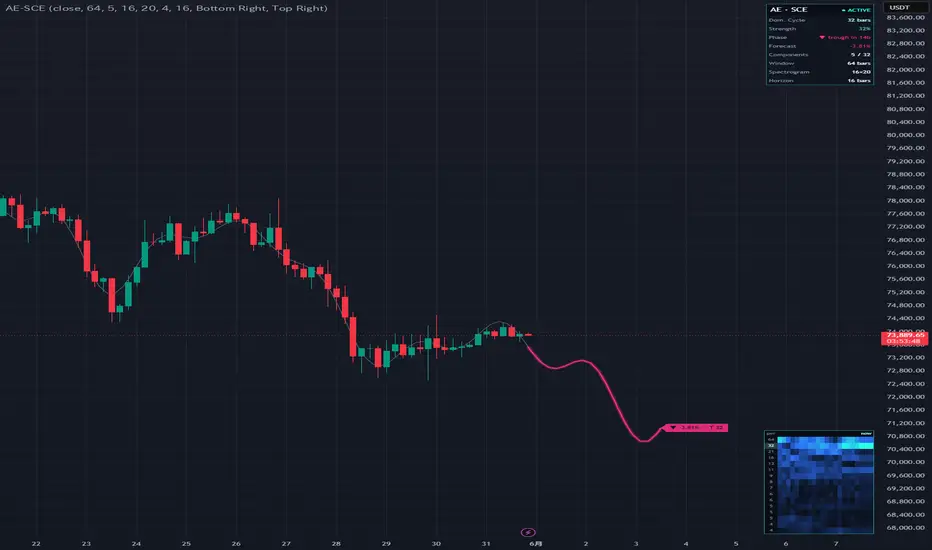
AE-SCE is a market frequency lens that exposes the cycles hiding inside price. It runs a Discrete Fourier Transform over a rolling window of linearly-detrended price, tracks the dominant cycle and its phase (rising/falling, bars-to-turn), reconstructs a denoised waveform from the strongest components and extrapolates it forward (Fourier projection), and paints a live spectrogram — period × time × amplitude — so you can watch cycles strengthen, fade, and migrate. The lens re-focuses every bar onto whichever cycles dominate now.
🔶 Key Features
DFT spectral engine — analyzes the frequency content (amplitude, phase, period) of a rolling window, quantifying the market's cyclical structure.
Dominant-cycle tracking — identifies the strongest period each bar and measures its strength (share of total spectrum).
Phase & turn forecast — from the dominant cycle's current phase, estimates rising/falling and "how many bars to the next peak/trough."
Fourier reconstruction + projection — rebuilds the waveform from the top-N components and extrapolates a forecast curve onto the chart.
Live spectrogram — a period (rows) × time (columns) × amplitude (color) heatmap, revealing the rise, fall, and migration of cycles at a glance.
Adaptive focus — rolling re-estimation keeps the lens trained on the current dominant cycle.
Live statistics panel — dominant period, strength, phase (turn forecast), projected return, and components used.
Efficient design — the trig basis is precomputed once, and the heavy transform runs only on the last bar, staying within Pine's runtime budget.
🧠 Technical Architecture
On each last bar, the newest length-N window is linearly detrended via least squares, and a DFT is applied to the residual. For each bin k=1..N/2 it computes real and imaginary parts, then amplitude A_k = (2/N)√(Re²+Im²), phase φ_k = atan2(Im,Re), and period T_k = N/k. The highest-amplitude bin within the displayed band is the dominant cycle, its strength measured as A* / ΣA. Reconstruction is the sum of the top-N components Σ A_k·cos(2πkm/N − φ_k) plus the linear trend; extending m beyond the window turns it into a forward projection.
The spectrogram applies the same transform to several windows shifted back by a stride, encoding each time-and-period amplitude as color. The phase-based turn forecast derives the dominant cycle's phase angle at the newest bar and converts the phase distance to a peak (cos=1) or trough (cos=−1) into bars. To keep it light, the cos/sin basis matrices are built once and reused, and the DFT itself runs only on the last bar. This is a spectral-analysis tool — not a learning model — that adapts to "the cycle of now" through rolling re-estimation.
🎯 Three design choices stand out. First, linear detrending suppresses trend leakage (spectral leakage), letting genuine cycles surface. Second, retaining phase lets it report not just amplitude but where in the cycle price sits. Third, the precomputed basis and last-bar concentration completely avoid the cost of recomputing across all history.
⚙️ Recommended Settings & Tuning Guide
As a crypto starting point — BTC/ETH (1D, 4H): window N = 64, 5 reconstruction components, spectrogram 16×20, stride 4, horizon 16; medium-to-long cyclical structure separates cleanly. High-volatility / short-term (SOL, XRP): shorten N toward 48 for faster response to shorter cycles, and narrow components to 3–4 to avoid pulling in noise, yielding a cleaner forecast curve.
Per parameter: Window (N) is the key — larger resolves longer cycles but adds lag and load; smaller is nimbler but misses long cycles. Reconstruction components set forecast smoothness — fewer give a smooth dominant-cycle curve, more track finer detail. Stride / columns set how far the spectrogram reaches back. Horizon sets projection length.
💡 How to Use in Practice
The core read is dominant cycle × phase × strength. When cycle strength is high and the phase reads "few bars to trough," it flags a potential dip + cycle reversal — a timing cue. Conversely "few bars to peak" is a candidate for taking profit or fading rallies. By watching the forecast curve's slope and whether price tracks it, you can judge whether cycles are in control (i.e., forecast reliability is high). When the spectrogram shows the dominant cycle migrating or splitting, the cyclical structure is changing — a sign your assumptions may be shifting.
For multi-timeframe work, read the larger cycle's phase on the higher timeframe and use shorter-cycle turns on the lower timeframe for execution. Pair it with trend tools and de-weight cycle forecasts when trends are strong.
⚠️ Important Notes
Nothing displays until warmup (window + spectrogram reach-back) completes. Fourier extrapolation assumes cycles persist, so forecast reliability drops sharply in strong trends or at structural breaks (regime changes). The reconstruction/forecast curve is redrawn every bar from the current spectrum and is not a frozen historical fit — it updates as new bars arrive. Spectral leakage from the finite window is mitigated by detrending, but cycles are not strictly stationary. Large windows or many columns over long history increase compute. This is a forecasting tool, not a certain future.
🚨 Disclaimer
This indicator is for educational and informational purposes only and does not constitute financial or investment advice. Past performance is not indicative of future results. All trading involves risk. Use it alongside your own thorough testing and sound risk management; all trading decisions remain solely your own responsibility.
AE-SCE is a market frequency lens that exposes the cycles hiding inside price. It runs a Discrete Fourier Transform over a rolling window of linearly-detrended price, tracks the dominant cycle and its phase (rising/falling, bars-to-turn), reconstructs a denoised waveform from the strongest components and extrapolates it forward (Fourier projection), and paints a live spectrogram — period × time × amplitude — so you can watch cycles strengthen, fade, and migrate. The lens re-focuses every bar onto whichever cycles dominate now.
🔶 Key Features
DFT spectral engine — analyzes the frequency content (amplitude, phase, period) of a rolling window, quantifying the market's cyclical structure.
Dominant-cycle tracking — identifies the strongest period each bar and measures its strength (share of total spectrum).
Phase & turn forecast — from the dominant cycle's current phase, estimates rising/falling and "how many bars to the next peak/trough."
Fourier reconstruction + projection — rebuilds the waveform from the top-N components and extrapolates a forecast curve onto the chart.
Live spectrogram — a period (rows) × time (columns) × amplitude (color) heatmap, revealing the rise, fall, and migration of cycles at a glance.
Adaptive focus — rolling re-estimation keeps the lens trained on the current dominant cycle.
Live statistics panel — dominant period, strength, phase (turn forecast), projected return, and components used.
Efficient design — the trig basis is precomputed once, and the heavy transform runs only on the last bar, staying within Pine's runtime budget.
🧠 Technical Architecture
On each last bar, the newest length-N window is linearly detrended via least squares, and a DFT is applied to the residual. For each bin k=1..N/2 it computes real and imaginary parts, then amplitude A_k = (2/N)√(Re²+Im²), phase φ_k = atan2(Im,Re), and period T_k = N/k. The highest-amplitude bin within the displayed band is the dominant cycle, its strength measured as A* / ΣA. Reconstruction is the sum of the top-N components Σ A_k·cos(2πkm/N − φ_k) plus the linear trend; extending m beyond the window turns it into a forward projection.
The spectrogram applies the same transform to several windows shifted back by a stride, encoding each time-and-period amplitude as color. The phase-based turn forecast derives the dominant cycle's phase angle at the newest bar and converts the phase distance to a peak (cos=1) or trough (cos=−1) into bars. To keep it light, the cos/sin basis matrices are built once and reused, and the DFT itself runs only on the last bar. This is a spectral-analysis tool — not a learning model — that adapts to "the cycle of now" through rolling re-estimation.
🎯 Three design choices stand out. First, linear detrending suppresses trend leakage (spectral leakage), letting genuine cycles surface. Second, retaining phase lets it report not just amplitude but where in the cycle price sits. Third, the precomputed basis and last-bar concentration completely avoid the cost of recomputing across all history.
⚙️ Recommended Settings & Tuning Guide
As a crypto starting point — BTC/ETH (1D, 4H): window N = 64, 5 reconstruction components, spectrogram 16×20, stride 4, horizon 16; medium-to-long cyclical structure separates cleanly. High-volatility / short-term (SOL, XRP): shorten N toward 48 for faster response to shorter cycles, and narrow components to 3–4 to avoid pulling in noise, yielding a cleaner forecast curve.
Per parameter: Window (N) is the key — larger resolves longer cycles but adds lag and load; smaller is nimbler but misses long cycles. Reconstruction components set forecast smoothness — fewer give a smooth dominant-cycle curve, more track finer detail. Stride / columns set how far the spectrogram reaches back. Horizon sets projection length.
💡 How to Use in Practice
The core read is dominant cycle × phase × strength. When cycle strength is high and the phase reads "few bars to trough," it flags a potential dip + cycle reversal — a timing cue. Conversely "few bars to peak" is a candidate for taking profit or fading rallies. By watching the forecast curve's slope and whether price tracks it, you can judge whether cycles are in control (i.e., forecast reliability is high). When the spectrogram shows the dominant cycle migrating or splitting, the cyclical structure is changing — a sign your assumptions may be shifting.
For multi-timeframe work, read the larger cycle's phase on the higher timeframe and use shorter-cycle turns on the lower timeframe for execution. Pair it with trend tools and de-weight cycle forecasts when trends are strong.
⚠️ Important Notes
Nothing displays until warmup (window + spectrogram reach-back) completes. Fourier extrapolation assumes cycles persist, so forecast reliability drops sharply in strong trends or at structural breaks (regime changes). The reconstruction/forecast curve is redrawn every bar from the current spectrum and is not a frozen historical fit — it updates as new bars arrive. Spectral leakage from the finite window is mitigated by detrending, but cycles are not strictly stationary. Large windows or many columns over long history increase compute. This is a forecasting tool, not a certain future.
🚨 Disclaimer
This indicator is for educational and informational purposes only and does not constitute financial or investment advice. Past performance is not indicative of future results. All trading involves risk. Use it alongside your own thorough testing and sound risk management; all trading decisions remain solely your own responsibility.
Skrip open-source
Dengan semangat TradingView yang sesungguhnya, pembuat skrip ini telah menjadikannya sebagai sumber terbuka, sehingga para trader dapat meninjau dan memverifikasi fungsinya. Salut untuk penulisnya! Meskipun Anda dapat menggunakannya secara gratis, perlu diingat bahwa penerbitan ulang kode ini tunduk pada Tata Tertib kami.

Pernyataan Penyangkalan
Informasi dan publikasi ini tidak dimaksudkan, dan bukan merupakan, saran atau rekomendasi keuangan, investasi, trading, atau jenis lainnya yang diberikan atau didukung oleh TradingView. Baca selengkapnya di Ketentuan Penggunaan.
Skrip open-source
Dengan semangat TradingView yang sesungguhnya, pembuat skrip ini telah menjadikannya sebagai sumber terbuka, sehingga para trader dapat meninjau dan memverifikasi fungsinya. Salut untuk penulisnya! Meskipun Anda dapat menggunakannya secara gratis, perlu diingat bahwa penerbitan ulang kode ini tunduk pada Tata Tertib kami.
Pernyataan Penyangkalan
Informasi dan publikasi ini tidak dimaksudkan, dan bukan merupakan, saran atau rekomendasi keuangan, investasi, trading, atau jenis lainnya yang diberikan atau didukung oleh TradingView. Baca selengkapnya di Ketentuan Penggunaan.