Diupdate
Liquidity Sweeps + Stop Depth [Rider Algo]
TITLE (copy into the title field):
Liquidity Sweeps + Stop Depth [Rider Algo]
DESCRIPTION (copy everything below this line):
How often does this market break a level just to take the stops, and how far does it go before coming back? Liquidity Sweeps + Stop Depth answers both questions from the history of the chart you are looking at. Think of it as a referee: every time price breaks equal highs or equal lows, it watches what happens next and writes down whether the break was real or a trap.
═══════════════════════════════════════════════════════════════════════════
HOW IT WORKS
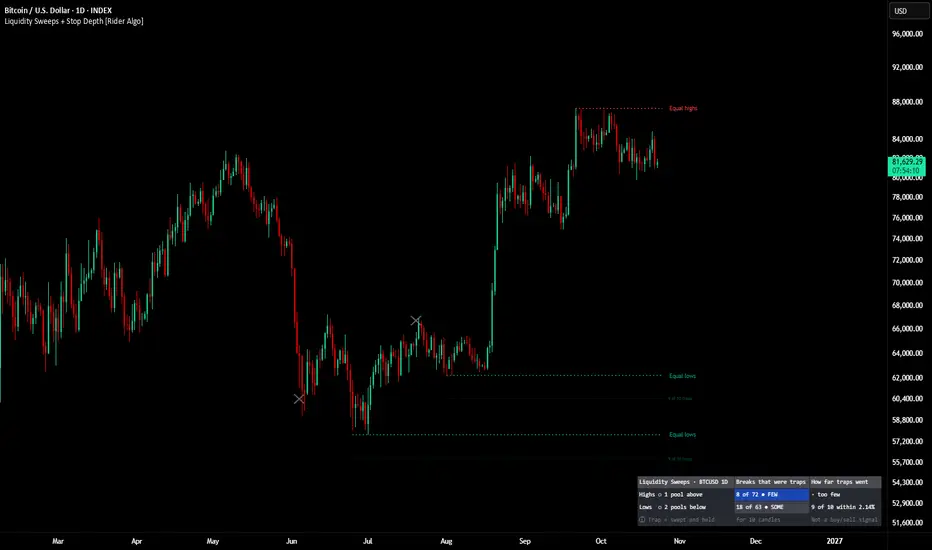
1. Pools. Two or more swing highs (or swing lows) at about the same price form a pool. Many traders place their stop orders just beyond these levels, so they are drawn as dotted lines: red for Equal highs, green for Equal lows. Only the pools nearest to price are shown.
2. Every break is sorted. When a closed candle goes beyond a pool, the indicator classifies it:
- Real break: the candle closes beyond the level.
- Sweep: the candle wicks beyond the level and closes back inside. A gray dot marks it while it is being judged.
3. Each sweep gets a verdict. Price then has a set number of candles (10 by default):
- TRAP (colored triangle): price never closes beyond the tip of the sweep wick. It went for the stops and came back.
- FAILED (gray cross): price closes beyond the tip of the wick. The break was real after all.
4. Stop depth. For every confirmed trap, the indicator records how far the wick went past the level, measured in ATR (the average size of one candle). From those records it draws a thin line beyond each pool: 9 of 10 past traps on this chart reached less far than that line.
5. Table. Equal highs and equal lows are counted separately: how many breaks were traps, and how far traps went.
Equal highs, equal lows and sweeps are well-known ideas in price action trading. What this script adds is the bookkeeping: a fixed, visible rule that sorts every break into real, failed or trap, a count per asset and timeframe, and a stop depth learned from the chart itself. The code is written from scratch and is open source.
═══════════════════════════════════════════════════════════════════════════
WHAT YOU SEE ON THE CHART
Dotted pool lines
Equal highs above price and equal lows below it. Hover the label to see how many swings form the pool and how long ago the first one was.
The "9 of 10 traps" line (the most practical output)
A fainter line just beyond each pool. A stop placed right at the level sits exactly where traps tend to reach. Beyond this line, 9 of 10 past traps on this chart would have missed it. Traders often use it to judge how much room a stop needs, or to see that a level is too crowded to place a stop near it. A real break goes through any stop, so this line measures traps only.
Markers
- Gray dot: a sweep is being judged.
- Colored triangle: TRAP confirmed. A line connects the pool to the sweep.
- Gray cross: FAILED. The break turned out to be real.
The table
- Left column: what each side is doing now, in plain words ("Highs ◌ 2 pools above", or "Lows ● Swept · 4 of 10" while a sweep is being judged).
- Middle column: "3 of 12 ● MANY" means 3 of the 12 judged breaks on this chart were traps. MANY (orange) from 30%: breaks here often go for the stops and come back. FEW (blue) below 15%: breaks here are usually real. SOME in between.
- Right column: "9 of 10 within 1.24%" means 9 of 10 traps reached less than 1.24% past the level, at today's volatility.
Hover any cell for the full detail: traps, failed sweeps, real breaks, and the depth in ATR and in price.
═══════════════════════════════════════════════════════════════════════════
HOW TO USE IT
1. Open the asset and timeframe you trade and read the middle column first. Is this a market that traps often (MANY) or one where breaks are usually real (FEW)?
2. Look at the nearest pools. These are the levels where the next sweep or break is likely to happen.
3. If you need a stop near one of these levels, check the "9 of 10 traps" line. A stop between the level and that line sits where past traps reached.
4. When a gray dot appears, wait for its verdict instead of guessing: a triangle means the sweep held, a cross means the break was real.
5. Compare timeframes and assets. The same rule can show many traps on one chart and few on another.
═══════════════════════════════════════════════════════════════════════════
INPUTS
1 · Liquidity Pools
- Swing size (default 3): candles on each side that make a swing high or low. Bigger = fewer, more important swings.
- Equal = within (ATR) (default 0.25): how close two swings must be to count as equal.
- Pool life (default 150 candles): the maximum distance between the two swings of a pool, and how long an untouched pool is kept.
- Pools shown per side (default 3): only the pools nearest to price are drawn.
- Colors for equal highs and equal lows.
2 · Traps
- Candles to confirm a trap (default 10): how long price has to close beyond the wick before a sweep counts as a trap. More candles = stricter, fewer traps.
- Mark past sweeps: dots, triangles, crosses and trap lines.
- Show the stop depth line: the "9 of 10 traps" line beyond each pool.
- Color for failed sweeps and sweeps being judged.
3 · Statistics
- Show table, Position and Size.
- Cases needed (default 8): below this number of judged breaks (or traps, for the depth) the table says "too few" instead of a count.
- MANY traps from (default 30%) and FEW traps below (default 15%): the cuts of the middle column.
═══════════════════════════════════════════════════════════════════════════
BUILT-IN ALERTS
- Equal highs swept / Equal lows swept: a candle wicked beyond a pool and closed back inside. The verdict is still pending.
- Trap confirmed at equal highs / Trap confirmed at equal lows: a sweep held for the full confirmation period.
═══════════════════════════════════════════════════════════════════════════
TECHNICAL NOTES
- Pine Script v6, open source (MPL 2.0).
- Everything is computed on closed candles. A swing is only known 3 candles after it forms (the swing size), so pools appear with that delay.
- A sweep marker changes once: gray dot while judging, then triangle or cross when its candles pass. After that it is final and never changes again.
- If one candle sweeps several pools on the same side, it is marked once on the chart; each pool is still counted in the table.
- The stop depth uses the 90th percentile of the last 500 confirmed traps per side, in ATR (14), converted to price with today's ATR.
- The trap share counts real breaks, failed sweeps and traps of each side. Sweeps still being judged are not counted yet.
- Results depend on the history loaded on the chart: more candles = more cases.
═══════════════════════════════════════════════════════════════════════════
PART OF THE RIDER ALGO ECOSYSTEM
- Use with Compression Box + Breakout Plan [Rider Algo] to see whether breakouts on this chart tend to be real or traps before planning one.
- Use with Expected Move Cone + Range Forecast [Rider Algo] to compare the stop depth with the normal size of the move.
- Use with Probability Clouds + Entry Level [Rider Algo] to place limit orders and stops with both views: where price usually goes, and where traps usually reach.
- Use with Rider Algo #2: Trend Detection to read sweeps in the context of the trend.
═══════════════════════════════════════════════════════════════════════════
EN ESPAÑOL
Liquidity Sweeps + Stop Depth marca los máximos y mínimos iguales (donde suelen estar los stops) y clasifica cada ruptura: ruptura real, barrido fallido o trampa (rompió con la mecha, cerró de vuelta y no volvió a cerrar más allá de la mecha en 10 velas). La tabla dice cuántas rupturas fueron trampas en este activo y temporalidad, y la línea "9 of 10 traps" muestra hasta dónde llegaron 9 de cada 10 trampas: un stop pegado al nivel queda justo donde las trampas lo alcanzan. Es una herramienta estadística, no una señal de compra o venta.
═══════════════════════════════════════════════════════════════════════════
DISCLAIMER
This indicator is a technical analysis tool designed to measure how often breaks of equal highs and equal lows turn out to be traps on the current chart, and how far those traps reach. It does NOT provide buy or sell signals, and it does NOT constitute financial, investment, or trading advice of any kind. Past patterns do not guarantee future market behavior. Always conduct your own analysis and consult with a qualified financial advisor before making any trading decisions. Use this tool at your own risk. The author is not responsible for any financial losses incurred from the use of this indicator.
Liquidity Sweeps + Stop Depth [Rider Algo]
DESCRIPTION (copy everything below this line):
How often does this market break a level just to take the stops, and how far does it go before coming back? Liquidity Sweeps + Stop Depth answers both questions from the history of the chart you are looking at. Think of it as a referee: every time price breaks equal highs or equal lows, it watches what happens next and writes down whether the break was real or a trap.
═══════════════════════════════════════════════════════════════════════════
HOW IT WORKS
1. Pools. Two or more swing highs (or swing lows) at about the same price form a pool. Many traders place their stop orders just beyond these levels, so they are drawn as dotted lines: red for Equal highs, green for Equal lows. Only the pools nearest to price are shown.
2. Every break is sorted. When a closed candle goes beyond a pool, the indicator classifies it:
- Real break: the candle closes beyond the level.
- Sweep: the candle wicks beyond the level and closes back inside. A gray dot marks it while it is being judged.
3. Each sweep gets a verdict. Price then has a set number of candles (10 by default):
- TRAP (colored triangle): price never closes beyond the tip of the sweep wick. It went for the stops and came back.
- FAILED (gray cross): price closes beyond the tip of the wick. The break was real after all.
4. Stop depth. For every confirmed trap, the indicator records how far the wick went past the level, measured in ATR (the average size of one candle). From those records it draws a thin line beyond each pool: 9 of 10 past traps on this chart reached less far than that line.
5. Table. Equal highs and equal lows are counted separately: how many breaks were traps, and how far traps went.
Equal highs, equal lows and sweeps are well-known ideas in price action trading. What this script adds is the bookkeeping: a fixed, visible rule that sorts every break into real, failed or trap, a count per asset and timeframe, and a stop depth learned from the chart itself. The code is written from scratch and is open source.
═══════════════════════════════════════════════════════════════════════════
WHAT YOU SEE ON THE CHART
Dotted pool lines
Equal highs above price and equal lows below it. Hover the label to see how many swings form the pool and how long ago the first one was.
The "9 of 10 traps" line (the most practical output)
A fainter line just beyond each pool. A stop placed right at the level sits exactly where traps tend to reach. Beyond this line, 9 of 10 past traps on this chart would have missed it. Traders often use it to judge how much room a stop needs, or to see that a level is too crowded to place a stop near it. A real break goes through any stop, so this line measures traps only.
Markers
- Gray dot: a sweep is being judged.
- Colored triangle: TRAP confirmed. A line connects the pool to the sweep.
- Gray cross: FAILED. The break turned out to be real.
The table
- Left column: what each side is doing now, in plain words ("Highs ◌ 2 pools above", or "Lows ● Swept · 4 of 10" while a sweep is being judged).
- Middle column: "3 of 12 ● MANY" means 3 of the 12 judged breaks on this chart were traps. MANY (orange) from 30%: breaks here often go for the stops and come back. FEW (blue) below 15%: breaks here are usually real. SOME in between.
- Right column: "9 of 10 within 1.24%" means 9 of 10 traps reached less than 1.24% past the level, at today's volatility.
Hover any cell for the full detail: traps, failed sweeps, real breaks, and the depth in ATR and in price.
═══════════════════════════════════════════════════════════════════════════
HOW TO USE IT
1. Open the asset and timeframe you trade and read the middle column first. Is this a market that traps often (MANY) or one where breaks are usually real (FEW)?
2. Look at the nearest pools. These are the levels where the next sweep or break is likely to happen.
3. If you need a stop near one of these levels, check the "9 of 10 traps" line. A stop between the level and that line sits where past traps reached.
4. When a gray dot appears, wait for its verdict instead of guessing: a triangle means the sweep held, a cross means the break was real.
5. Compare timeframes and assets. The same rule can show many traps on one chart and few on another.
═══════════════════════════════════════════════════════════════════════════
INPUTS
1 · Liquidity Pools
- Swing size (default 3): candles on each side that make a swing high or low. Bigger = fewer, more important swings.
- Equal = within (ATR) (default 0.25): how close two swings must be to count as equal.
- Pool life (default 150 candles): the maximum distance between the two swings of a pool, and how long an untouched pool is kept.
- Pools shown per side (default 3): only the pools nearest to price are drawn.
- Colors for equal highs and equal lows.
2 · Traps
- Candles to confirm a trap (default 10): how long price has to close beyond the wick before a sweep counts as a trap. More candles = stricter, fewer traps.
- Mark past sweeps: dots, triangles, crosses and trap lines.
- Show the stop depth line: the "9 of 10 traps" line beyond each pool.
- Color for failed sweeps and sweeps being judged.
3 · Statistics
- Show table, Position and Size.
- Cases needed (default 8): below this number of judged breaks (or traps, for the depth) the table says "too few" instead of a count.
- MANY traps from (default 30%) and FEW traps below (default 15%): the cuts of the middle column.
═══════════════════════════════════════════════════════════════════════════
BUILT-IN ALERTS
- Equal highs swept / Equal lows swept: a candle wicked beyond a pool and closed back inside. The verdict is still pending.
- Trap confirmed at equal highs / Trap confirmed at equal lows: a sweep held for the full confirmation period.
═══════════════════════════════════════════════════════════════════════════
TECHNICAL NOTES
- Pine Script v6, open source (MPL 2.0).
- Everything is computed on closed candles. A swing is only known 3 candles after it forms (the swing size), so pools appear with that delay.
- A sweep marker changes once: gray dot while judging, then triangle or cross when its candles pass. After that it is final and never changes again.
- If one candle sweeps several pools on the same side, it is marked once on the chart; each pool is still counted in the table.
- The stop depth uses the 90th percentile of the last 500 confirmed traps per side, in ATR (14), converted to price with today's ATR.
- The trap share counts real breaks, failed sweeps and traps of each side. Sweeps still being judged are not counted yet.
- Results depend on the history loaded on the chart: more candles = more cases.
═══════════════════════════════════════════════════════════════════════════
PART OF THE RIDER ALGO ECOSYSTEM
- Use with Compression Box + Breakout Plan [Rider Algo] to see whether breakouts on this chart tend to be real or traps before planning one.
- Use with Expected Move Cone + Range Forecast [Rider Algo] to compare the stop depth with the normal size of the move.
- Use with Probability Clouds + Entry Level [Rider Algo] to place limit orders and stops with both views: where price usually goes, and where traps usually reach.
- Use with Rider Algo #2: Trend Detection to read sweeps in the context of the trend.
═══════════════════════════════════════════════════════════════════════════
EN ESPAÑOL
Liquidity Sweeps + Stop Depth marca los máximos y mínimos iguales (donde suelen estar los stops) y clasifica cada ruptura: ruptura real, barrido fallido o trampa (rompió con la mecha, cerró de vuelta y no volvió a cerrar más allá de la mecha en 10 velas). La tabla dice cuántas rupturas fueron trampas en este activo y temporalidad, y la línea "9 of 10 traps" muestra hasta dónde llegaron 9 de cada 10 trampas: un stop pegado al nivel queda justo donde las trampas lo alcanzan. Es una herramienta estadística, no una señal de compra o venta.
═══════════════════════════════════════════════════════════════════════════
DISCLAIMER
This indicator is a technical analysis tool designed to measure how often breaks of equal highs and equal lows turn out to be traps on the current chart, and how far those traps reach. It does NOT provide buy or sell signals, and it does NOT constitute financial, investment, or trading advice of any kind. Past patterns do not guarantee future market behavior. Always conduct your own analysis and consult with a qualified financial advisor before making any trading decisions. Use this tool at your own risk. The author is not responsible for any financial losses incurred from the use of this indicator.
Catatan Rilis
Version 2.1 fixes the stop depth on charts with very old, low-priced history. On INDEX:BTCUSD daily, candles from the early years have an ATR close to zero, so a normal wick read as many ATR and the "9 of 10 traps" depth for equal highs could show an impossible value. The trap counts were not affected.═══════════════════════════════════════════════════════════════════════════
WHAT'S NEW
1. Depth only from usable candles. A trap is still counted, but its depth is not measured when the ATR of its candle is under 10 ticks.
2. New input: Traps needed for the depth (default 12). Below it, the depth says "too few" and its line is not drawn. With fewer traps, "9 of 10" would just be the single deepest one, so one odd candle could set it.
3. "Cases needed" is now "Breaks needed" and only applies to the trap count.
═══════════════════════════════════════════════════════════════════════════
HOW TO USE IT
1. Read the middle column first: MANY, SOME or FEW traps on this chart.
2. If the depth column shows a value, use the "9 of 10 traps" line to judge how much room a stop near a level would need.
3. If it says "too few", this side has not had enough measured traps yet: try a lower timeframe or wait for more history.
═══════════════════════════════════════════════════════════════════════════
PLEASE NOTE
- The new input was added at the end of the settings list, so the existing settings stay in place.
- On some charts the depth of one side may now say "too few" where it showed a number before. That is intended: the old number came from too few traps.
- Alerts are unchanged.
═══════════════════════════════════════════════════════════════════════════
This indicator is a technical analysis tool designed to measure how often breaks of equal highs and equal lows turn out to be traps on the current chart, and how far those traps reach. It does NOT provide buy or sell signals, and it does NOT constitute financial, investment, or trading advice of any kind. Past patterns do not guarantee future market behavior. Always conduct your own analysis and consult with a qualified financial advisor before making any trading decisions. Use this tool at your own risk. The author is not responsible for any financial losses incurred from the use of this indicator.

Trend first. No fear, no FOMO: just a plan and execution.
— Rider Algo (Scripts tab on my profile)
Not financial advice.
— Rider Algo (Scripts tab on my profile)
Not financial advice.
Pernyataan Penyangkalan
Informasi dan publikasi ini tidak dimaksudkan, dan bukan merupakan, saran atau rekomendasi keuangan, investasi, trading, atau jenis lainnya yang diberikan atau didukung oleh TradingView. Baca selengkapnya di Ketentuan Penggunaan.
Trend first. No fear, no FOMO: just a plan and execution.
— Rider Algo (Scripts tab on my profile)
Not financial advice.
— Rider Algo (Scripts tab on my profile)
Not financial advice.
Pernyataan Penyangkalan
Informasi dan publikasi ini tidak dimaksudkan, dan bukan merupakan, saran atau rekomendasi keuangan, investasi, trading, atau jenis lainnya yang diberikan atau didukung oleh TradingView. Baca selengkapnya di Ketentuan Penggunaan.