OPEN-SOURCE SCRIPT
BOS, CHoCH and CISD [theEccentricTrader]
█ OVERVIEW
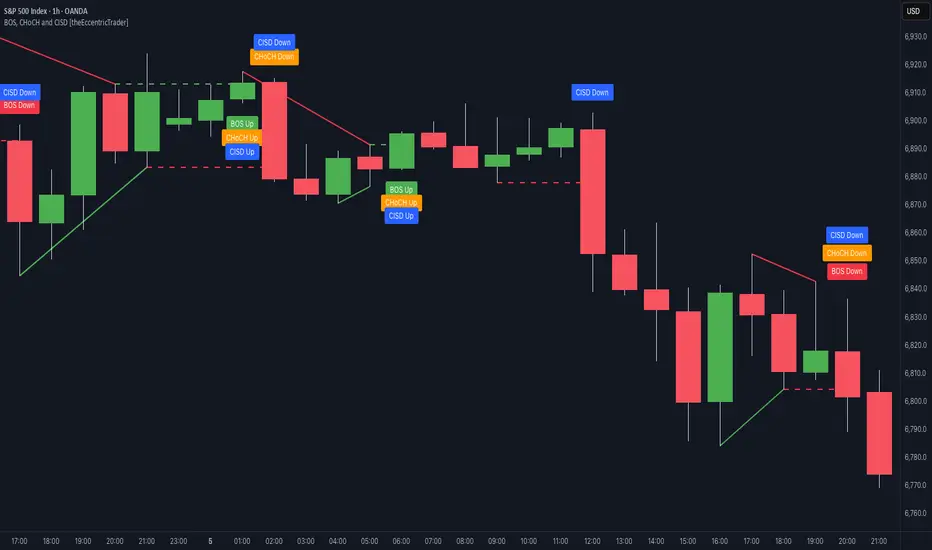
This open-source indicator plots Break of Structure (BOS), Change of Character (CHoCH) and Change in State of Delivery (CISD) events directly on the chart and provides optional alerts for each condition.
All conditions are built around my primitive swing logic and are confirmed at candle close to avoid repainting.
The script is designed as a research tool, not a trading strategy. It does not generate entries, exits, targets or risk management rules. Its purpose is to make objectively defined market structure events visible, reproducible and testable across markets and timeframes.
█ CONCEPTS
Green and Red Candles
A green candle is defined as a candle that closes at or above its open.
A red candle is defined as a candle that closes below its open.
Swing Highs and Swing Lows
A swing high is defined as a green candle, or a series of consecutive green candles, followed by a single red candle that completes the swing and forms the peak.
A swing low is defined as a red candle, or a series of consecutive red candles, followed by a single green candle that completes the swing and forms the trough.
Peak and Trough Prices
The peak price of a complete swing high is either the high of the red candle that completes the swing or the high of the preceding green candle, depending on which is higher.
The trough price of a complete swing low is either the low of the green candle that completes the swing or the low of the preceding red candle, depending on which is lower.
Basic Uptrends and Downtrends
Basic uptrends, henceforth referred to as uptrends, are formed when the most recent trough is higher than the preceding trough.
Basic downtrends, henceforth referred to as downtrends, are formed when the most recent peak is lower than the preceding peak.
Break of Structure (BOS)
A BOS occurs when price continues in the direction of the prevailing trend by breaking beyond the most recent peak or trough price. BOS implies trend continuation through structural expansion.
BOS Up occurs during an uptrend when price closes above the most recent peak.
BOS Down occurs during a downtrend when price closes below the most recent trough.
Change of Character (CHoCH)
A CHoCH occurs during an uptrend or downtrend when price breaks the most recent peak or trough price in the opposite direction to the prevailing trend, without fully reversing the higher-level trend structure. CHoCH implies early structural weakness or internal rotation rather than confirmed trend reversal.
CHoCH Up occurs during a downtrend when price closes above the most recent peak but remains below the preceding peak.
CHoCH Down occurs during an uptrend when price closes below the most recent trough but remains above the preceding trough.
Change in State of Delivery (CISD)
A CISD occurs when price breaks the most recent peak or trough price. CISD isolates pure structural displacement, independent of trend classification.
CISD Up occurs when price closes above the most recent peak without regard for trend state.
CISD Down occurs when price closes below the most recent trough without regard for trend state.
█ VISUAL OUTPUTS
Labels
Labels are plotted at the candle where each condition is confirmed.
Users can change the label colours and sizes via indicator Settings/Inputs/LABELS.
Event Lines
Horizontal dashed lines mark the peak or trough that was broken.
Trend Lines
Trend lines are drawn to contextualise trend direction for appropriate structural events.
█ ALERTS
Optional alerts are provided for all conditions. By default, all alerts are set to false.
Users can apply alerts via Indicator Settings/Inputs/ALERTS.
This open-source indicator plots Break of Structure (BOS), Change of Character (CHoCH) and Change in State of Delivery (CISD) events directly on the chart and provides optional alerts for each condition.
All conditions are built around my primitive swing logic and are confirmed at candle close to avoid repainting.
The script is designed as a research tool, not a trading strategy. It does not generate entries, exits, targets or risk management rules. Its purpose is to make objectively defined market structure events visible, reproducible and testable across markets and timeframes.
█ CONCEPTS
Green and Red Candles
A green candle is defined as a candle that closes at or above its open.
A red candle is defined as a candle that closes below its open.
Swing Highs and Swing Lows
A swing high is defined as a green candle, or a series of consecutive green candles, followed by a single red candle that completes the swing and forms the peak.
A swing low is defined as a red candle, or a series of consecutive red candles, followed by a single green candle that completes the swing and forms the trough.
Peak and Trough Prices
The peak price of a complete swing high is either the high of the red candle that completes the swing or the high of the preceding green candle, depending on which is higher.
The trough price of a complete swing low is either the low of the green candle that completes the swing or the low of the preceding red candle, depending on which is lower.
Basic Uptrends and Downtrends
Basic uptrends, henceforth referred to as uptrends, are formed when the most recent trough is higher than the preceding trough.
Basic downtrends, henceforth referred to as downtrends, are formed when the most recent peak is lower than the preceding peak.
Break of Structure (BOS)
A BOS occurs when price continues in the direction of the prevailing trend by breaking beyond the most recent peak or trough price. BOS implies trend continuation through structural expansion.
BOS Up occurs during an uptrend when price closes above the most recent peak.
BOS Down occurs during a downtrend when price closes below the most recent trough.
Change of Character (CHoCH)
A CHoCH occurs during an uptrend or downtrend when price breaks the most recent peak or trough price in the opposite direction to the prevailing trend, without fully reversing the higher-level trend structure. CHoCH implies early structural weakness or internal rotation rather than confirmed trend reversal.
CHoCH Up occurs during a downtrend when price closes above the most recent peak but remains below the preceding peak.
CHoCH Down occurs during an uptrend when price closes below the most recent trough but remains above the preceding trough.
Change in State of Delivery (CISD)
A CISD occurs when price breaks the most recent peak or trough price. CISD isolates pure structural displacement, independent of trend classification.
CISD Up occurs when price closes above the most recent peak without regard for trend state.
CISD Down occurs when price closes below the most recent trough without regard for trend state.
█ VISUAL OUTPUTS
Labels
Labels are plotted at the candle where each condition is confirmed.
Users can change the label colours and sizes via indicator Settings/Inputs/LABELS.
Event Lines
Horizontal dashed lines mark the peak or trough that was broken.
Trend Lines
Trend lines are drawn to contextualise trend direction for appropriate structural events.
█ ALERTS
Optional alerts are provided for all conditions. By default, all alerts are set to false.
Users can apply alerts via Indicator Settings/Inputs/ALERTS.
Skrip open-source
Dengan semangat TradingView yang sesungguhnya, pembuat skrip ini telah menjadikannya sebagai sumber terbuka, sehingga para trader dapat meninjau dan memverifikasi fungsinya. Salut untuk penulisnya! Meskipun Anda dapat menggunakannya secara gratis, perlu diingat bahwa penerbitan ulang kode ini tunduk pada Tata Tertib kami.

Pernyataan Penyangkalan
Informasi dan publikasi ini tidak dimaksudkan, dan bukan merupakan, saran atau rekomendasi keuangan, investasi, trading, atau jenis lainnya yang diberikan atau didukung oleh TradingView. Baca selengkapnya di Ketentuan Penggunaan.
Skrip open-source
Dengan semangat TradingView yang sesungguhnya, pembuat skrip ini telah menjadikannya sebagai sumber terbuka, sehingga para trader dapat meninjau dan memverifikasi fungsinya. Salut untuk penulisnya! Meskipun Anda dapat menggunakannya secara gratis, perlu diingat bahwa penerbitan ulang kode ini tunduk pada Tata Tertib kami.
Pernyataan Penyangkalan
Informasi dan publikasi ini tidak dimaksudkan, dan bukan merupakan, saran atau rekomendasi keuangan, investasi, trading, atau jenis lainnya yang diberikan atau didukung oleh TradingView. Baca selengkapnya di Ketentuan Penggunaan.