OPEN-SOURCE SCRIPT
Forex Pulse Matrix [forexobroker]
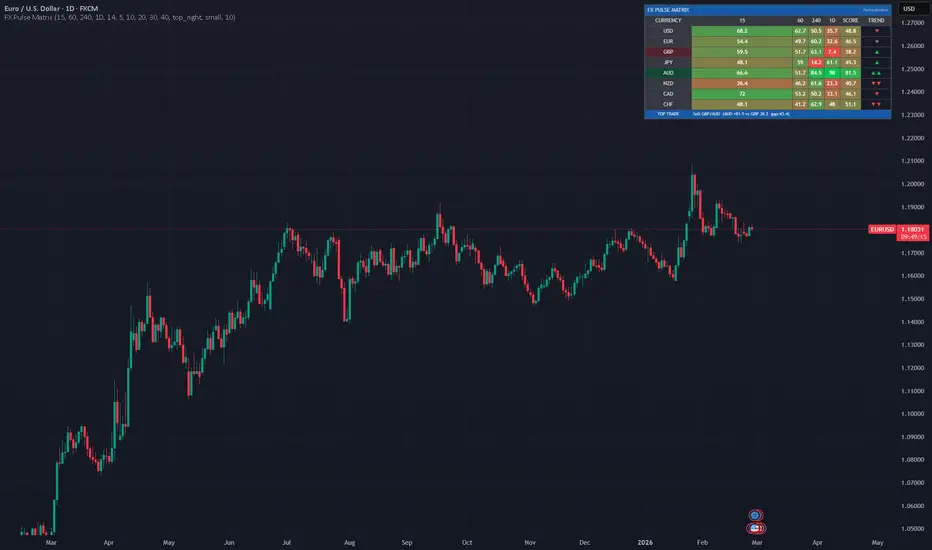
Forex Pulse Matrix is a professional currency strength analysis dashboard that gives you an instant, at-a-glance view of which currencies are strong and which are weak — across 4 customizable timeframes — all in one clean heatmap table.
WHAT IT DOES
This indicator analyzes the strength of 8 major currencies (USD, EUR, GBP, JPY, AUD, NZD, CAD, CHF) by measuring the Rate of Change (ROC) across 7 USD-denominated pairs. Each cell in the heatmap is color-coded from red (weak) to green (strong) on a 0-100 normalized scale, making it instantly readable.
At the bottom of the table, the indicator automatically identifies the strongest and weakest currencies and suggests the highest-probability pair to trade.
HOW IT WORKS
The strength calculation uses a contribution-based methodology:
Rate of Change (ROC) is calculated for each of 7 USD-based pairs (EURUSD, GBPUSD, USDJPY, AUDUSD, NZDUSD, USDCAD, USDCHF) across 4 timeframes
Each pair's ROC is distributed to the base and quote currency — for example, a rising EURUSD contributes positive strength to EUR and negative strength to USD
USD aggregates contributions from all 7 pairs; other currencies use their single USD-pair
Raw values are normalized to a 0-100 scale per timeframe using dynamic min-max normalization across all 8 currencies
EMA smoothing is applied to reduce noise
A weighted composite score combines all 4 timeframes (default: 15m=10%, 1H=20%, 4H=30%, 1D=40%)
This approach ensures relative comparison — you always see which currency is strongest and weakest at any moment.
FEATURES
Color-coded heatmap dashboard — red (weak) to green (strong) gradient for instant pattern recognition
4 customizable timeframes — default 15m, 1H, 4H, 1D with adjustable weights
Weighted composite score — higher timeframes carry more weight by default for trend-aligned trading
Trend arrows — ▲▲ (strong bullish), ▲ (bullish), ◆ (neutral), ▼ (bearish), ▼▼ (strong bearish)
Automatic best-trade detection — pairs the strongest currency against the weakest and shows proper FX pair name with buy/sell direction
Strongest/weakest highlighting — currency labels are highlighted with green or red backgrounds
FX Pulse Index — optional oscillator showing overall market dispersion (how spread out the currencies are from equilibrium)
9 alert conditions — one per currency plus an "any shift" alert for significant strength changes
Dark/light theme support — automatically adapts to your chart theme
Data Window integration — all 8 strength values visible in TradingView's Data Window
HOW TO READ THE HEATMAP
Values near 100 (bright green) = that currency is the strongest performer on that timeframe
Values near 0 (bright red) = that currency is the weakest performer on that timeframe
Values near 50 (transitional color) = neutral, no clear strength or weakness
SCORE column = weighted composite across all 4 timeframes
TREND arrows show the momentum direction (is the score rising or falling?)
USE CASES
Pair Selection — find the best pair to trade by looking at which currencies are diverging (one strong, one weak)
Confirmation — confirm your existing trade idea by checking if the currencies involved are trending in the right direction across multiple timeframes
Correlation Awareness — avoid taking two trades where the same currency dominates (e.g., buying both EUR/USD and EUR/JPY when EUR is strong)
Session Analysis — switch to different timeframe combinations to see which currencies are active during different trading sessions
Trend Alignment — higher timeframe weights help you trade in the direction of the dominant trend
SETTINGS
Timeframes: Configure which 4 timeframes to analyze (default: 15m, 1H, 4H, 1D)
Calculation: ROC Length controls the lookback period for strength measurement (default 14). Smoothing applies an EMA to reduce noise (default 5).
Scoring Weights: Adjust how much each timeframe contributes to the composite score. Default weights prioritize higher timeframes (10/20/30/40) for trend-following alignment. Set equal weights (25/25/25/25) for a balanced view.
Display: Choose table position, text size, and toggle the best-trade suggestion and pulse oscillator.
Colors: Customize the strong (green) and weak (red) colors to match your chart theme.
Alerts: Set the threshold for currency strength shift alerts. Lower values = more frequent alerts.
FX PULSE INDEX (Optional)
Enable "Show Pulse Plot" to see an oscillator measuring FX market dispersion — how far apart the currency strengths are from equilibrium (50). High dispersion (above 35) means strong trends exist. Low dispersion (below 20) means currencies are ranging near equilibrium — less directional opportunity.
TECHNICAL NOTES
Uses 28 of 40 available security calls (7 pairs x 4 timeframes)
Non-repainting — all calculations use confirmed bar data with lookahead disabled
Table updates only on the last bar for optimal performance
Works on any chart symbol and timeframe — the dashboard pulls its own data independently
Strength values are RELATIVE — they show which currency is strongest/weakest compared to the others, not absolute momentum
DISCLAIMER
This indicator is for educational and informational purposes only. It does not constitute financial advice. Currency strength analysis should be used as one component of a complete trading methodology that includes proper risk management. Past performance does not guarantee future results. Always use stop losses and trade within your risk tolerance.
WHAT IT DOES
This indicator analyzes the strength of 8 major currencies (USD, EUR, GBP, JPY, AUD, NZD, CAD, CHF) by measuring the Rate of Change (ROC) across 7 USD-denominated pairs. Each cell in the heatmap is color-coded from red (weak) to green (strong) on a 0-100 normalized scale, making it instantly readable.
At the bottom of the table, the indicator automatically identifies the strongest and weakest currencies and suggests the highest-probability pair to trade.
HOW IT WORKS
The strength calculation uses a contribution-based methodology:
Rate of Change (ROC) is calculated for each of 7 USD-based pairs (EURUSD, GBPUSD, USDJPY, AUDUSD, NZDUSD, USDCAD, USDCHF) across 4 timeframes
Each pair's ROC is distributed to the base and quote currency — for example, a rising EURUSD contributes positive strength to EUR and negative strength to USD
USD aggregates contributions from all 7 pairs; other currencies use their single USD-pair
Raw values are normalized to a 0-100 scale per timeframe using dynamic min-max normalization across all 8 currencies
EMA smoothing is applied to reduce noise
A weighted composite score combines all 4 timeframes (default: 15m=10%, 1H=20%, 4H=30%, 1D=40%)
This approach ensures relative comparison — you always see which currency is strongest and weakest at any moment.
FEATURES
Color-coded heatmap dashboard — red (weak) to green (strong) gradient for instant pattern recognition
4 customizable timeframes — default 15m, 1H, 4H, 1D with adjustable weights
Weighted composite score — higher timeframes carry more weight by default for trend-aligned trading
Trend arrows — ▲▲ (strong bullish), ▲ (bullish), ◆ (neutral), ▼ (bearish), ▼▼ (strong bearish)
Automatic best-trade detection — pairs the strongest currency against the weakest and shows proper FX pair name with buy/sell direction
Strongest/weakest highlighting — currency labels are highlighted with green or red backgrounds
FX Pulse Index — optional oscillator showing overall market dispersion (how spread out the currencies are from equilibrium)
9 alert conditions — one per currency plus an "any shift" alert for significant strength changes
Dark/light theme support — automatically adapts to your chart theme
Data Window integration — all 8 strength values visible in TradingView's Data Window
HOW TO READ THE HEATMAP
Values near 100 (bright green) = that currency is the strongest performer on that timeframe
Values near 0 (bright red) = that currency is the weakest performer on that timeframe
Values near 50 (transitional color) = neutral, no clear strength or weakness
SCORE column = weighted composite across all 4 timeframes
TREND arrows show the momentum direction (is the score rising or falling?)
USE CASES
Pair Selection — find the best pair to trade by looking at which currencies are diverging (one strong, one weak)
Confirmation — confirm your existing trade idea by checking if the currencies involved are trending in the right direction across multiple timeframes
Correlation Awareness — avoid taking two trades where the same currency dominates (e.g., buying both EUR/USD and EUR/JPY when EUR is strong)
Session Analysis — switch to different timeframe combinations to see which currencies are active during different trading sessions
Trend Alignment — higher timeframe weights help you trade in the direction of the dominant trend
SETTINGS
Timeframes: Configure which 4 timeframes to analyze (default: 15m, 1H, 4H, 1D)
Calculation: ROC Length controls the lookback period for strength measurement (default 14). Smoothing applies an EMA to reduce noise (default 5).
Scoring Weights: Adjust how much each timeframe contributes to the composite score. Default weights prioritize higher timeframes (10/20/30/40) for trend-following alignment. Set equal weights (25/25/25/25) for a balanced view.
Display: Choose table position, text size, and toggle the best-trade suggestion and pulse oscillator.
Colors: Customize the strong (green) and weak (red) colors to match your chart theme.
Alerts: Set the threshold for currency strength shift alerts. Lower values = more frequent alerts.
FX PULSE INDEX (Optional)
Enable "Show Pulse Plot" to see an oscillator measuring FX market dispersion — how far apart the currency strengths are from equilibrium (50). High dispersion (above 35) means strong trends exist. Low dispersion (below 20) means currencies are ranging near equilibrium — less directional opportunity.
TECHNICAL NOTES
Uses 28 of 40 available security calls (7 pairs x 4 timeframes)
Non-repainting — all calculations use confirmed bar data with lookahead disabled
Table updates only on the last bar for optimal performance
Works on any chart symbol and timeframe — the dashboard pulls its own data independently
Strength values are RELATIVE — they show which currency is strongest/weakest compared to the others, not absolute momentum
DISCLAIMER
This indicator is for educational and informational purposes only. It does not constitute financial advice. Currency strength analysis should be used as one component of a complete trading methodology that includes proper risk management. Past performance does not guarantee future results. Always use stop losses and trade within your risk tolerance.
Skrip open-source
Dengan semangat TradingView yang sesungguhnya, pembuat skrip ini telah menjadikannya sebagai sumber terbuka, sehingga para trader dapat meninjau dan memverifikasi fungsinya. Salut untuk penulisnya! Meskipun Anda dapat menggunakannya secara gratis, perlu diingat bahwa penerbitan ulang kode ini tunduk pada Tata Tertib kami.

🔵Gain access to our powerful tools : kestutisbalciunas.com/tradingview/
🔵Join our free telegram for updates : t.me/algotradingedge
All scripts & content provided by Forexobroker are for informational & educational purposes only.
🔵Join our free telegram for updates : t.me/algotradingedge
All scripts & content provided by Forexobroker are for informational & educational purposes only.
Pernyataan Penyangkalan
Informasi dan publikasi ini tidak dimaksudkan, dan bukan merupakan, saran atau rekomendasi keuangan, investasi, trading, atau jenis lainnya yang diberikan atau didukung oleh TradingView. Baca selengkapnya di Ketentuan Penggunaan.
Skrip open-source
Dengan semangat TradingView yang sesungguhnya, pembuat skrip ini telah menjadikannya sebagai sumber terbuka, sehingga para trader dapat meninjau dan memverifikasi fungsinya. Salut untuk penulisnya! Meskipun Anda dapat menggunakannya secara gratis, perlu diingat bahwa penerbitan ulang kode ini tunduk pada Tata Tertib kami.
🔵Gain access to our powerful tools : kestutisbalciunas.com/tradingview/
🔵Join our free telegram for updates : t.me/algotradingedge
All scripts & content provided by Forexobroker are for informational & educational purposes only.
🔵Join our free telegram for updates : t.me/algotradingedge
All scripts & content provided by Forexobroker are for informational & educational purposes only.
Pernyataan Penyangkalan
Informasi dan publikasi ini tidak dimaksudkan, dan bukan merupakan, saran atau rekomendasi keuangan, investasi, trading, atau jenis lainnya yang diberikan atau didukung oleh TradingView. Baca selengkapnya di Ketentuan Penggunaan.