OPEN-SOURCE SCRIPT
Diupdate [blackcat] L2 Ehlers Predictive Average
Level: 2
Background
John F. Ehlers introuced Predictive Average in his "Rocket Science for Traders" chapter 20 on 2001.
Function
The concept of taking a difference of lagging line from the original function to produce a leading function suggests extending the concept to moving averages. There is no direct theory for this, but it seems to work pretty well. If taking a 7-bar WMA of prices, that average lags the prices by 2 bars. If taking a 7-bar WMA of the first average, this second average is delayed another 2 bars. If taking the difference between the two averages and add that difference to the first average, the result should be a smoothed line of the original price function with no lag. Sure, Dr. Ehlers tried to use more lag for the second moving average, which
should produce a better predictive curve. However, remember the lesson of Chapter 3 of the book. An analysis curve cannot precede an event. You cannot predict an event before it occurs. If then taking a 4-bar WMA of the smoothed line to create a 1-bar lag, this lagging line becomes a signal when the lines cross. This is as close to an ideal indicator as we can get.
Key Signal
Predict ---> moving average fast line
Trigger ---> moving average slow line
Pros and Cons
100% John F. Ehlers definition translation of original work, even variable names are the same. This help readers who would like to use pine to read his book. If you had read his works, then you will be quite familiar with my code style.
Remarks
The 17th script for Blackcat1402 John F. Ehlers Week publication.
Readme
In real life, I am a prolific inventor. I have successfully applied for more than 60 international and regional patents in the past 12 years. But in the past two years or so, I have tried to transfer my creativity to the development of trading strategies. Tradingview is the ideal platform for me. I am selecting and contributing some of the hundreds of scripts to publish in Tradingview community. Welcome everyone to interact with me to discuss these interesting pine scripts.
The scripts posted are categorized into 5 levels according to my efforts or manhours put into these works.
Level 1 : interesting script snippets or distinctive improvement from classic indicators or strategy. Level 1 scripts can usually appear in more complex indicators as a function module or element.
Level 2 : composite indicator/strategy. By selecting or combining several independent or dependent functions or sub indicators in proper way, the composite script exhibits a resonance phenomenon which can filter out noise or fake trading signal to enhance trading confidence level.
Level 3 : comprehensive indicator/strategy. They are simple trading systems based on my strategies. They are commonly containing several or all of entry signal, close signal, stop loss, take profit, re-entry, risk management, and position sizing techniques. Even some interesting fundamental and mass psychological aspects are incorporated.
Level 4 : script snippets or functions that do not disclose source code. Interesting element that can reveal market laws and work as raw material for indicators and strategies. If you find Level 1~2 scripts are helpful, Level 4 is a private version that took me far more efforts to develop.
Level 5 : indicator/strategy that do not disclose source code. private version of Level 3 script with my accumulated script processing skills or a large number of custom functions. I had a private function library built in past two years. Level 5 scripts use many of them to achieve private trading strategy.
Catatan Rilis
Correct label bar_index issueCatatan Rilis
Correct a display errorCatatan Rilis
OVERVIEWThe [blackcat] L2 Ehlers Predictive Average is a technical indicator that combines the Ehlers Predictive Average with a secondary trigger line to enhance trading signals. It provides predictive price movements and generates buy/sell alerts based on crossovers between the main and trigger lines.
FEATURES
• Two-line visualization: Predictive Average and Trigger Line
• Color-coded fill area between lines
• Automatic BUY/SELL labels at crossover points
• Customizable source price input
HOW TO USE
Add the indicator to your chart
Select your preferred source price (default: HL2)
Monitor the interaction between the Predictive Average and Trigger Line
Look for crossover signals: • Predictive Average crosses above Trigger Line → BUY signal • Predictive Average crosses below Trigger Line → SELL signal
LIMITATIONS
• Works best in trending markets
• May generate false signals during sideways movement
• Requires confirmation with other indicators for optimal results
NOTES
• The indicator uses a weighted moving average calculation for enhanced prediction accuracy
• The fill area changes color based on the relationship between the two lines
• Labels are automatically removed after 10 bars to prevent clutter
Catatan Rilis
█ OVERVIEWEhlers Predictive Average is a trend-following indicator that applies John Ehlers' predictive average algorithm to identify potential trend reversals and generate actionable buy and sell signals. It combines a dual weighted moving average structure with a state-managed signal system to filter noise and reduce false entries.
█ CONCEPTS
The script uses a two-stage weighted moving average calculation to produce a predictive value that anticipates price movement. A trigger line smooths the predictive value to generate crossover and crossunder signals. A state machine governs signal validity, ensuring only one position direction is active at a time with configurable cooldown periods.
Key principles:
• Trend Detection: The predictive average leads price action by anticipating directional changes
• Signal Filtering: A state machine and cooldown mechanism prevent signal chatter and same-bar conflicts
• Risk Management: ATR-based take profit and stop loss levels provide structured exit references
• Visual Feedback: Background coloring and a dashboard table display current position state at a glance
█ HOW TO USE
1 — Add the indicator to your TradingView chart and observe the predictive average line and trigger line interaction
2 — Configure input parameters in the settings panel: adjust ATR length, stop loss and take profit multipliers, and signal governance options
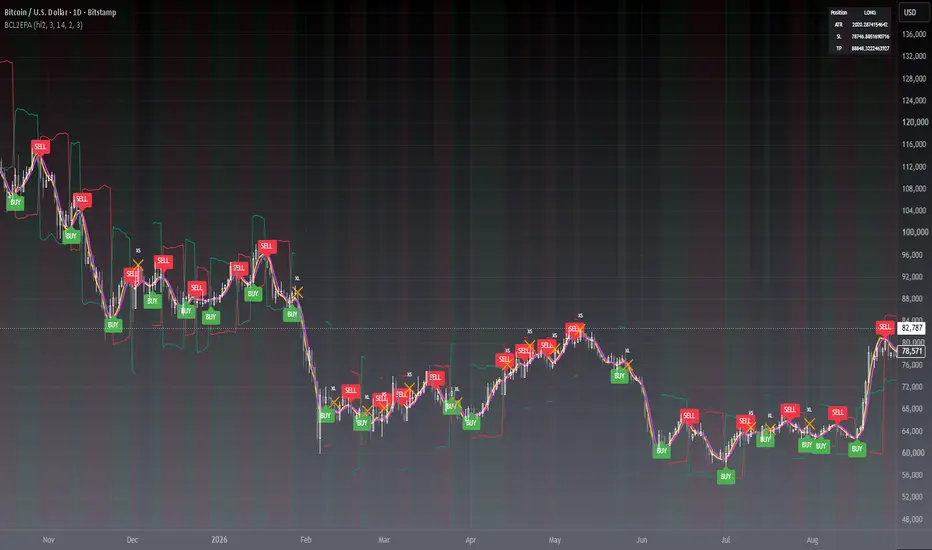
3 — Interpret signals: green BUY labels indicate long entries, red SELL labels indicate short entries, orange XL/XS labels indicate exits
4 — Use the dashboard table to monitor current position state, ATR value, and active TP/SL levels
5 — Enable or disable short signals, background coloring, and the dashboard as preferred
Input Parameters
• Source Price: The price source used for calculation (default: hl2)
• Enable Short Signals: Toggle short signal generation on or off (default: enabled)
• Same-bar Entry/Exit Exclusivity: Prevents entry and exit signals on the same bar (default: enabled)
• Cooldown Bars: Minimum number of bars between consecutive signals (default: 3, range: 0 to 20)
• ATR Length: Period for the Average True Range calculation (default: 14)
• Stop Loss (xATR): Stop loss distance as a multiple of ATR (default: 2.0, minimum: 0.5)
• Take Profit (xATR): Take profit distance as a multiple of ATR (default: 3.0, minimum: 0.5)
• Show TP/SL Levels: Toggle display of take profit and stop loss reference lines (default: enabled)
• Show Dashboard: Toggle the position information table (default: enabled)
• Show Background: Toggle position-based background coloring (default: enabled)
█ FEATURES
• State-Managed Signals: A position state machine ensures only one directional signal is active at a time, with configurable cooldown bars between signals
• ATR-Based Risk Management: Dynamic stop loss and take profit levels calculated from ATR multiples, adapting to market volatility
• Visual Dashboard: A real-time table displays current position state, ATR value, and active TP/SL levels
• Background Coloring: Chart background changes color based on current position direction for immediate visual feedback
• Alert Support: Independent alert conditions for long entry, short entry, long exit, and short exit events
• Signal Exclusivity: Configurable same-bar entry/exit mutual exclusion to prevent conflicting signals
█ SIGNALS
Visual Elements
• BUY Label: A green upward label appears at the bar low when a long entry signal fires, indicating a potential long opportunity
• SELL Label: A red downward label appears at the bar high when a short entry signal fires, indicating a potential short opportunity
• XL/XS Labels: Orange X-cross labels mark exit points when a position is closed by a reverse signal
• Background Color: Light green background indicates a long position; light red indicates a short position; no background indicates flat
• TP/SL Lines: Dashed red and teal lines show the current stop loss and take profit levels when enabled
• Dashboard Table: A compact table in the top-right corner summarizes position state, ATR, SL, and TP values
Signal Interpretation
1 — A BUY signal suggests the predictive average has crossed above the trigger line, indicating a potential upward trend
2 — A SELL signal suggests the predictive average has crossed below the trigger line, indicating a potential downward trend
3 — An exit label (XL or XS) indicates the position should be closed based on a reverse crossover or crossunder
4 — The dashboard provides a quick reference for the current position state and risk levels
█ IMPLEMENTATION NOTES
This open-source indicator uses the following built-in functions: ta.crossover, ta.crossunder, ta.atr, and request.security is not used. The signal system employs a state machine with edge-triggered conditions and configurable cooldown bars. The ATR-based TP/SL levels are calculated using ta.atr and plotted as reference lines. All alert conditions are declared at the global scope with freq_once_per_bar_close frequency. The indicator declaration includes max_labels_count = 500 to manage label accumulation.
█ LIMITATIONS
• Best suited for trending markets; may produce false signals in ranging or choppy conditions
• The predictive average is a leading indicator and may generate premature signals during volatile price action
• ATR-based TP/SL levels are reference points only and do not ensure execution prices
• Cooldown bars setting may cause missed signals in fast-moving markets if set too high
• Not recommended for use on timeframes below 5 minutes due to increased noise
█ NOTES
• Based on John Ehlers' predictive average algorithm
• The original V1 script has been polished to include state management, risk controls, and enhanced visualization
• All parameters are configurable and can be adjusted to suit different markets and timeframes
• Attribution to the original author: blackcat1402
═════════════════════════════════════════════════════════════════════════
Feel free to use and modify — attribution appreciated.
Skrip open-source
Dengan semangat TradingView yang sesungguhnya, pembuat skrip ini telah menjadikannya sebagai sumber terbuka, sehingga para trader dapat meninjau dan memverifikasi fungsinya. Salut untuk penulisnya! Meskipun Anda dapat menggunakannya secara gratis, perlu diingat bahwa penerbitan ulang kode ini tunduk pada Tata Tertib kami.

Don't miss out! The first and most important thing to do is to join my Discord chat now! Click here to start your adventure: discord.com/invite/ZTGpQJq My new github for more pine development soon: github.com/wxt-coder
Pernyataan Penyangkalan
Informasi dan publikasi ini tidak dimaksudkan, dan bukan merupakan, saran atau rekomendasi keuangan, investasi, trading, atau jenis lainnya yang diberikan atau didukung oleh TradingView. Baca selengkapnya di Ketentuan Penggunaan.
Skrip open-source
Dengan semangat TradingView yang sesungguhnya, pembuat skrip ini telah menjadikannya sebagai sumber terbuka, sehingga para trader dapat meninjau dan memverifikasi fungsinya. Salut untuk penulisnya! Meskipun Anda dapat menggunakannya secara gratis, perlu diingat bahwa penerbitan ulang kode ini tunduk pada Tata Tertib kami.
Don't miss out! The first and most important thing to do is to join my Discord chat now! Click here to start your adventure: discord.com/invite/ZTGpQJq My new github for more pine development soon: github.com/wxt-coder
Pernyataan Penyangkalan
Informasi dan publikasi ini tidak dimaksudkan, dan bukan merupakan, saran atau rekomendasi keuangan, investasi, trading, atau jenis lainnya yang diberikan atau didukung oleh TradingView. Baca selengkapnya di Ketentuan Penggunaan.