Diupdate
Gianluca ATR Volatility Regime [CCE_Charts]
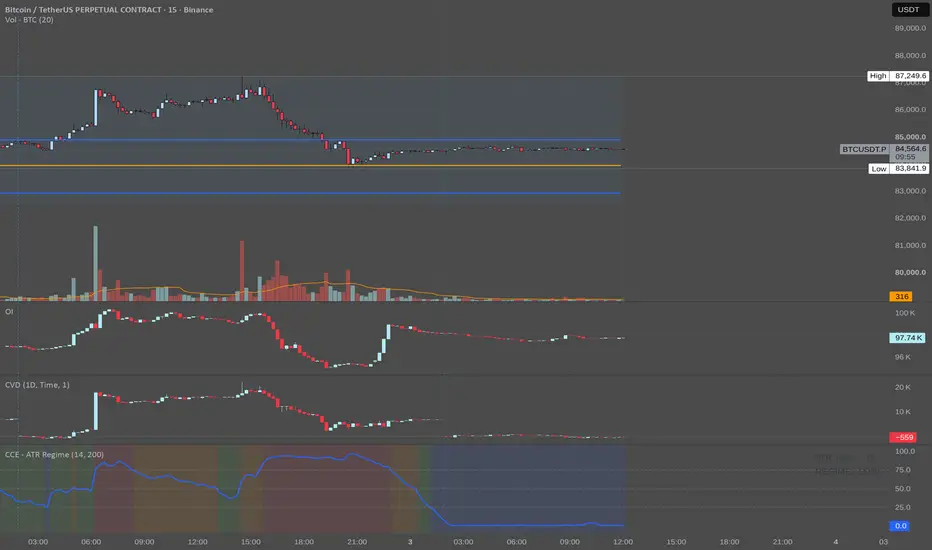
ATR Volatility Regime
This indicator classifies the current market volatility into four objective regimes using ATR Percentile.
The methodology uses the following calibration:
- ATR Length: 14
- Percentile Length: 200
The current ATR is compared against its historical values over the percentile lookback period. This converts the absolute ATR value into a relative volatility measure from 0 to 100.
Volatility Regimes
| ATR Percentile | Regime |
|---|---|
| 0–25 | LOW |
| 26–50 | MEDIUM |
| 51–75 | HIGH |
| 76–100 | EXTREME |
The purpose of the indicator is to make volatility regimes objective and comparable across different market conditions. Instead of asking whether a particular ATR value is "high" or "low", the indicator shows where the current volatility stands relative to its recent historical distribution.
The 14 / 200 calibration follows the methodology presented by Gianluca in his trading framework and is intended as a volatility-regime classification rather than a standalone trading signal.
Important: This indicator does not predict price direction or provide buy/sell signals. It identifies the current volatility environment, which can then be used to filter and evaluate a trading strategy.
This indicator classifies the current market volatility into four objective regimes using ATR Percentile.
The methodology uses the following calibration:
- ATR Length: 14
- Percentile Length: 200
The current ATR is compared against its historical values over the percentile lookback period. This converts the absolute ATR value into a relative volatility measure from 0 to 100.
Volatility Regimes
| ATR Percentile | Regime |
|---|---|
| 0–25 | LOW |
| 26–50 | MEDIUM |
| 51–75 | HIGH |
| 76–100 | EXTREME |
The purpose of the indicator is to make volatility regimes objective and comparable across different market conditions. Instead of asking whether a particular ATR value is "high" or "low", the indicator shows where the current volatility stands relative to its recent historical distribution.
The 14 / 200 calibration follows the methodology presented by Gianluca in his trading framework and is intended as a volatility-regime classification rather than a standalone trading signal.
Important: This indicator does not predict price direction or provide buy/sell signals. It identifies the current volatility environment, which can then be used to filter and evaluate a trading strategy.
Catatan Rilis
Added alert conditions.
Pernyataan Penyangkalan
Informasi dan publikasi ini tidak dimaksudkan, dan bukan merupakan, saran atau rekomendasi keuangan, investasi, trading, atau jenis lainnya yang diberikan atau didukung oleh TradingView. Baca selengkapnya di Ketentuan Penggunaan.
Pernyataan Penyangkalan
Informasi dan publikasi ini tidak dimaksudkan, dan bukan merupakan, saran atau rekomendasi keuangan, investasi, trading, atau jenis lainnya yang diberikan atau didukung oleh TradingView. Baca selengkapnya di Ketentuan Penggunaan.