MSS / Automated Projections / SwingHL
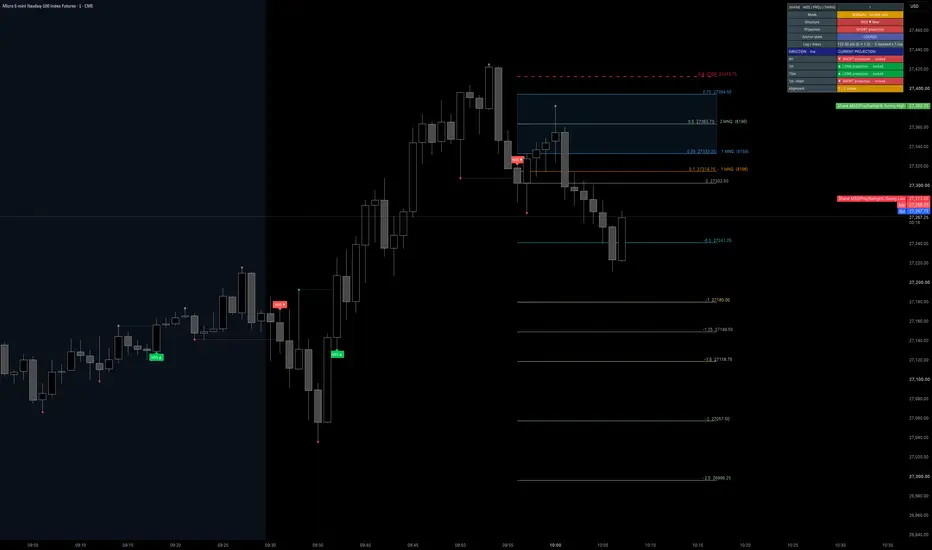
MSS / Automated Projections / SwingHL is a visual-only TradingView indicator for finding structure reversals and planning entries off them.
It marks swing highs and lows with dots. When a candle closes through the last swing against the current trend, it labels a Market Structure Shift (MSS). Only reversals get labelled; continuation breaks are tracked quietly.
Each MSS draws a standard-deviation projection. The 1.0 is the origin swing of the move, and the 0.0 is the MSS candle’s close. The 0.0 keeps trailing with each candle closing in the same direction, then locks on the first opposing candle. The full level set runs from 0.75 down to −4, with 0.25–0.75 shaded as the entry zone. A dashed red 0.9 stop line is added.
Once the projection locks, the 0.1, 0.25 and 0.5 entry labels show how many contracts of the charted product risk your fixed dollar amount (default $250) to the 0.9 stop. The dollar risk at that size is shown next to it. The point value comes from the symbol, so it works on MNQ, NQ, MES, ES and others.
An info panel shows the current structure, projection direction and whether the anchor is trailing or locked. It also shows the projection direction on 4H, 1H and 15m, plus an alignment tally against the chart timeframe.
Standard mode keeps the last few projections on screen, dimmed. Manual mode shows only the live one.
Alerts are available for:
an MSS
a new projection
a lock
a higher-timeframe direction flip
full higher-timeframe alignment
It marks swing highs and lows with dots. When a candle closes through the last swing against the current trend, it labels a Market Structure Shift (MSS). Only reversals get labelled; continuation breaks are tracked quietly.
Each MSS draws a standard-deviation projection. The 1.0 is the origin swing of the move, and the 0.0 is the MSS candle’s close. The 0.0 keeps trailing with each candle closing in the same direction, then locks on the first opposing candle. The full level set runs from 0.75 down to −4, with 0.25–0.75 shaded as the entry zone. A dashed red 0.9 stop line is added.
Once the projection locks, the 0.1, 0.25 and 0.5 entry labels show how many contracts of the charted product risk your fixed dollar amount (default $250) to the 0.9 stop. The dollar risk at that size is shown next to it. The point value comes from the symbol, so it works on MNQ, NQ, MES, ES and others.
An info panel shows the current structure, projection direction and whether the anchor is trailing or locked. It also shows the projection direction on 4H, 1H and 15m, plus an alignment tally against the chart timeframe.
Standard mode keeps the last few projections on screen, dimmed. Manual mode shows only the live one.
Alerts are available for:
an MSS
a new projection
a lock
a higher-timeframe direction flip
full higher-timeframe alignment

Pernyataan Penyangkalan
Informasi dan publikasi ini tidak dimaksudkan, dan bukan merupakan, saran atau rekomendasi keuangan, investasi, trading, atau jenis lainnya yang diberikan atau didukung oleh TradingView. Baca selengkapnya di Ketentuan Penggunaan.
Pernyataan Penyangkalan
Informasi dan publikasi ini tidak dimaksudkan, dan bukan merupakan, saran atau rekomendasi keuangan, investasi, trading, atau jenis lainnya yang diberikan atau didukung oleh TradingView. Baca selengkapnya di Ketentuan Penggunaan.