Dynamic EMA Ribbon
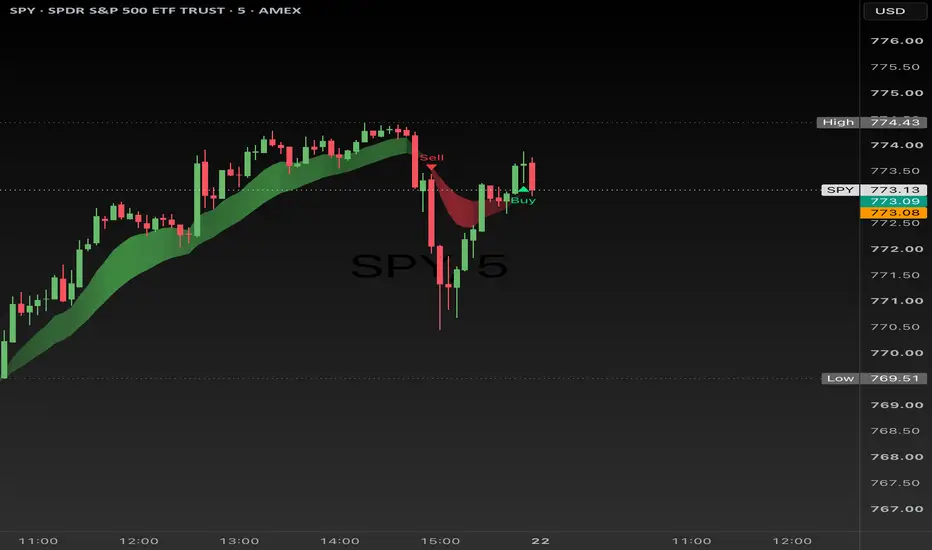
Dynamic EMA Ribbon
This is a clean way to visualize trend direction and strength using the classic 9 and 21 EMAs.
It fills the area between the two EMAs:
The fill isn’t static. It gets stronger and more opaque the farther the EMAs move apart (based on ATR). When they’re close together the ribbon stays light and quiet. When they start separating with real momentum, the color becomes much more solid. That makes it easy to tell the difference between a strong trend and just mild drifting.
The actual EMA lines are transparent by default so the chart stays clean — you mostly just see the colored ribbon. You can turn the lines back on in the settings if you want them.
There are also optional Buy/Sell arrows based on the 9/21 crossover. You can enable them for these timeframes:
The arrows only show up when you’re actually on that timeframe, so they don’t clutter the chart. By default the 1-min, 5-min, and 15-min signals are turned on.
Why it’s useful
How I use it
Strong green ribbon → looking for longs or continuation
Strong red ribbon → looking for shorts or continuation
Light/fading ribbon → staying cautious
Ribbon flip + matching arrow → higher-probability entry
Everything is adjustable in the settings (colors, sensitivity, which timeframes show signals, arrow size, etc.).
Designed to stay out of the way while still giving clear, strength-weighted information.
This is a clean way to visualize trend direction and strength using the classic 9 and 21 EMAs.
It fills the area between the two EMAs:
- Green when the 9 is above the 21 (bullish)
- Red when the 9 is below the 21 (bearish)
The fill isn’t static. It gets stronger and more opaque the farther the EMAs move apart (based on ATR). When they’re close together the ribbon stays light and quiet. When they start separating with real momentum, the color becomes much more solid. That makes it easy to tell the difference between a strong trend and just mild drifting.
The actual EMA lines are transparent by default so the chart stays clean — you mostly just see the colored ribbon. You can turn the lines back on in the settings if you want them.
There are also optional Buy/Sell arrows based on the 9/21 crossover. You can enable them for these timeframes:
- 1-minute
- 3-minute
- 5-minute
- 10-minute
- 15-minute
The arrows only show up when you’re actually on that timeframe, so they don’t clutter the chart. By default the 1-min, 5-min, and 15-min signals are turned on.
- Green “Buy” arrow = 9 crossed above 21
- Red “Sell” arrow = 9 crossed below 21
Why it’s useful
- Shows both direction and conviction in one glance
- Stays quiet during choppy or consolidating conditions
- Highlights stronger moves without needing extra indicators
- Keeps the chart very clean
- Flexible signal system with individual timeframe toggles
How I use it
Strong green ribbon → looking for longs or continuation
Strong red ribbon → looking for shorts or continuation
Light/fading ribbon → staying cautious
Ribbon flip + matching arrow → higher-probability entry
Everything is adjustable in the settings (colors, sensitivity, which timeframes show signals, arrow size, etc.).
Designed to stay out of the way while still giving clear, strength-weighted information.

Pernyataan Penyangkalan
Informasi dan publikasi ini tidak dimaksudkan, dan bukan merupakan, saran atau rekomendasi keuangan, investasi, trading, atau jenis lainnya yang diberikan atau didukung oleh TradingView. Baca selengkapnya di Ketentuan Penggunaan.
Pernyataan Penyangkalan
Informasi dan publikasi ini tidak dimaksudkan, dan bukan merupakan, saran atau rekomendasi keuangan, investasi, trading, atau jenis lainnya yang diberikan atau didukung oleh TradingView. Baca selengkapnya di Ketentuan Penggunaan.