OPEN-SOURCE SCRIPT
StructureX Market Structure & Liquidity Engine [CLEVER]
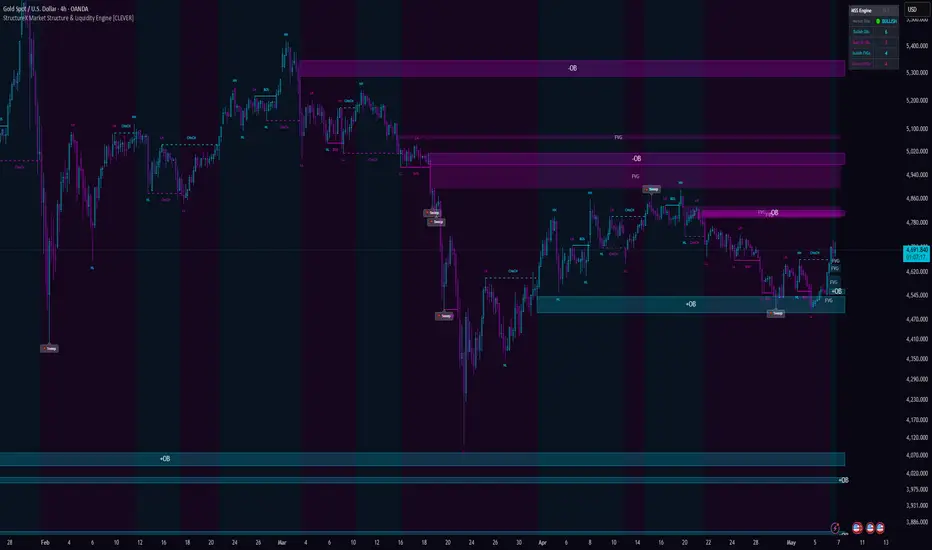
🧠 StructureX – Deep Overview
StructureX – Market Structure & Liquidity Engine is a comprehensive price action framework designed to interpret and visualize the natural structure of the market. Its primary objective is to transform raw price movement into a clear and organized structure, where highs, lows, and their relationships are logically defined. Instead of relying on random candle behavior, the system helps users understand how price is actually moving within a structured environment.
At its core, StructureX is built on the idea that markets are not entirely random — they move in structured phases of expansion, retracement, and transition. The system tracks these phases using rule-based calculations derived from historical price data. This ensures that the output remains consistent and systematic, rather than subjective. The focus is not on predicting the future, but on providing a clearer understanding of the current market context, allowing users to make more informed decisions within a defined framework.
StructureX integrates multiple structural elements into a single unified model, offering a layered view of market behavior. Key turning points, structural breaks, and imbalance areas are all presented together on the chart, reducing the need for multiple separate tools. This integration enhances clarity and allows users to evaluate market conditions more efficiently, with all relevant structural information available in one place.
In terms of real-time behavior, the system operates using confirmation-based logic. Certain calculations—especially those related to swing detection—require additional candles to confirm, which can introduce a slight delay. During live candle formation, some elements may temporarily update or adjust, but the structure becomes more stable once the candle closes. This is a normal and expected characteristic of structure-based analytical systems, as confirmation helps reduce noise and improve reliability.
Overall, StructureX functions as a decision-support tool that simplifies complex market behavior into a structured and readable format. It does not provide financial advice or guarantee outcomes, but instead offers a disciplined, rule-based approach to analyzing price action. By focusing on structure and context, it enables users to approach the market with greater clarity and consistency.
🧠 Core Concept – StructureX
The core concept behind StructureX is built on a simple but powerful principle: price moves in a structured way, not randomly. Instead of treating the market as unpredictable noise, the system focuses on identifying how price forms highs, lows, and transitions between them, which together define the underlying structure of the market. This structure becomes the foundation for understanding trend direction, continuation, and potential shifts.
At the heart of this approach is the idea that every market phase is a result of interaction between buying and selling pressure, which is reflected through the formation and breaking of key levels. When price creates a series of higher highs and higher lows, it reflects bullish structure; when it forms lower highs and lower lows, it reflects bearish structure. StructureX tracks these formations in a rule-based way, ensuring that structure identification is consistent and not based on subjective interpretation.
Another key part of the concept is structural validation through break events. The system does not assume a trend change or continuation until price clearly interacts with previously established levels. This is where events like Break of Structure (BOS) and Change of Character (CHoCH) come into play. These are not predictions, but confirmations that the market has either maintained its direction or transitioned into a new phase. By waiting for these confirmations, the system prioritizes clarity over speed, reducing the impact of market noise.
StructureX also incorporates the idea that price does not move efficiently at all times. There are moments where imbalances and liquidity interactions occur, leading to areas where price may react or stabilize. Instead of treating these as guaranteed reversal zones, the system presents them as contextual areas of interest, which can be used alongside structure for more informed analysis. This keeps the framework realistic and avoids over-reliance on any single factor.
Importantly, the entire concept is rule-based and data-driven, meaning all outputs are derived from historical and current price action without any forward-looking assumptions. Some components require confirmation over multiple candles, which can introduce slight delays, but this trade-off helps improve stability and reduce false signals. Real-time updates during candle formation are normal, and the structure becomes more reliable once conditions are fully confirmed.
In essence, the core concept of StructureX is to provide a structured lens through which market behavior can be interpreted, combining clarity, consistency, and multiple layers of context. It does not aim to predict exact outcomes or guarantee results, but rather to offer a disciplined framework that helps users better understand how price evolves over time and make decisions based on observable structure rather than guesswork.
⚙️ Key Features – StructureX
StructureX is designed as a multi-layered market structure framework, where each feature plays a specific role in helping users interpret price action more clearly. Instead of relying on a single signal, the system combines several rule-based components to provide a more complete view of market behavior.
🔹 1. Swing-Based Market Structure Detection
The system automatically identifies swing highs and swing lows using a defined lookback range. These points act as the foundation of the entire framework, as they represent where price has naturally turned in the past. By mapping these levels, StructureX creates a clear structural outline of the market, allowing users to visually understand how price is evolving over time.
🔹 2. Break of Structure (BOS) Identification
StructureX highlights when price breaks a previously established structural level in the direction of the current trend. This is referred to as a Break of Structure (BOS), and it indicates that the market is continuing its existing directional movement. These events are based on confirmed price interaction with key levels, helping reduce ambiguity in trend continuation analysis.
🔹 3. Change of Character (CHoCH) Detection
The system also detects potential structural transitions through Change of Character (CHoCH) events. These occur when price moves against the current structure and breaks a key level, signaling that market conditions may be shifting. Rather than predicting reversals, this feature provides early structural context that the current trend may be weakening or transitioning.
🔹 4. Order Block Visualization
StructureX marks potential order block zones, which are derived from the last opposing candles before significant structural moves. These zones are presented as areas where price has previously shown strong reaction. They are not guaranteed reaction points, but serve as contextual zones of interest where users may observe how price behaves if revisited.
🔹 5. Fair Value Gap (FVG) Detection
The system identifies price imbalances, commonly referred to as Fair Value Gaps. These occur when price moves quickly, leaving areas where trading activity was relatively low. StructureX highlights these zones to show where price may revisit or stabilize, offering additional context for understanding inefficient market movement.
🔹 6. Liquidity Sweep Identification
StructureX includes logic to detect liquidity sweeps, where price temporarily moves beyond key highs or lows and then rejects. This reflects areas where stop orders may have been triggered. The system marks these events as observational signals, helping users recognize potential shifts in short-term market behavior without making predictive claims.
🔹 7. Internal Structure (Optional Layer)
An optional internal structure feature allows users to view minor structural movements within the main trend. This adds a deeper level of analysis for those who want to study short-term fluctuations while still maintaining the broader structural context.
🔹 8. Dynamic Visualization & Trend Background
The indicator provides visual clarity through structure lines, labels, and optional background coloring based on market bias. This helps users quickly interpret whether the market is currently aligned in a bullish, bearish, or neutral state, improving readability without adding unnecessary complexity.
🔹 9. Customizable Settings
StructureX offers a range of inputs that allow users to adjust sensitivity and visual preferences, such as swing length, detection ranges, and display options. This flexibility ensures the tool can be adapted to different trading styles and timeframes without altering its core logic.
🔹 10. Alert System for Key Events
The built-in alert functionality enables users to receive notifications when important structural events occur, such as BOS, CHoCH, or liquidity sweeps. This allows for more efficient monitoring without needing to constantly watch the chart.
🏁 Summary
👉
StructureX combines multiple rule-based features—structure detection, break events, imbalance zones, and liquidity behavior—into a single framework, providing a clear and structured view of market activity without relying on predictive assumptions.
⚙️ How It Works – StructureX
StructureX operates as a rule-based analytical engine that processes price data step by step to build a structured view of the market. Instead of generating signals from a single condition, it follows a logical sequence of detection → validation → visualization, where each layer depends on the previous one.
🔹 1. Price Data Processing & Swing Identification
The system begins by scanning historical and current price data to detect swing highs and swing lows within a defined lookback range. These swings represent natural turning points in the market and form the base structure. Since this process requires surrounding candles for confirmation, there is a built-in delay that helps filter out noise and avoid premature signals.
🔹 2. Structure Formation & Bias Tracking
Once swings are identified, the system uses them to construct a market structure framework. By comparing current swings with previous ones, it determines whether the market is forming:
Higher highs / higher lows → bullish structure
Lower highs / lower lows → bearish structure
This comparison allows the system to maintain a dynamic market bias, which updates only when specific structural conditions are met. The bias is not predicted—it is derived from confirmed price behavior.
🔹 3. Break Validation (BOS & CHoCH)
After establishing structure, the system monitors how price interacts with key levels:
If price breaks a level in the direction of the current bias, it is marked as a Break of Structure (BOS), indicating continuation.
If price breaks a level against the current bias, it is marked as a Change of Character (CHoCH), suggesting a potential transition.
These events are only recognized when price clearly crosses and confirms the level, which helps reduce false interpretations and ensures consistency.
🔹 4. Contextual Zone Detection (Order Blocks & FVG)
Once a structural event (BOS/CHoCH) occurs, the system identifies contextual zones around that movement:
Order Blocks are derived from the last opposing candles before a strong move, highlighting areas where price previously showed strong reaction.
Fair Value Gaps (FVGs) are detected when price moves quickly, leaving behind areas of imbalance.
These zones are not treated as guaranteed reaction points. Instead, they are presented as areas of interest, providing additional context for how price might behave if revisited.
🔹 5. Liquidity Interaction Monitoring
The system also evaluates liquidity behavior, specifically looking for scenarios where price moves beyond recent highs or lows and then rejects. These are marked as liquidity sweeps, which can indicate short-term shifts in order flow. This feature helps users observe how price interacts with commonly targeted levels, without assuming a fixed outcome.
🔹 6. Continuous Update & Object Management
StructureX continuously updates all elements in real time:
Active zones (OBs/FVGs) are extended forward until they are invalidated
Old or mitigated zones are removed to keep the chart clean
Structure levels are maintained and updated as new data forms
This ensures the chart reflects the current state of the market, not outdated conditions.
🔹 7. Visualization & User Interaction
All detected elements are displayed using lines, labels, boxes, and optional background coloring. The goal is to provide clear visual feedback without overwhelming the user. Additionally, customizable inputs allow users to adjust sensitivity and visibility based on their preferences, while alerts notify them of key structural events.
🔄 Real-Time Behavior Note
Because the system relies on confirmation-based logic, some elements (especially swings) require multiple candles to finalize. During live candle formation, temporary changes may occur, but the structure becomes more stable once conditions are confirmed. This behavior is normal and helps improve reliability by reducing noise.
🏁 Summary
👉
StructureX works by sequentially detecting swings, validating structure through break events, mapping contextual zones, and continuously updating the chart—providing a structured, rule-based interpretation of market behavior without relying on predictive assumptions.
📊 How It Is Used – StructureX
StructureX is used as a structured analysis tool, not as a standalone signal generator. Its purpose is to help users read market conditions step by step, so decisions are based on context and confirmation, rather than isolated signals or assumptions.
🔹 1. Start with Market Structure Context
The first step is to observe the overall market structure displayed by the system. By looking at how price is forming highs and lows, users can determine whether the market is:
Moving upward (bullish structure)
Moving downward (bearish structure)
Or transitioning between phases
This step provides a directional framework, helping users avoid taking decisions against the broader structure.
🔹 2. Wait for Structural Confirmation (BOS / CHoCH)
Instead of reacting immediately to price movement, StructureX is typically used by waiting for confirmed structural events:
BOS (Break of Structure): suggests continuation within the current direction
CHoCH (Change of Character): indicates a possible transition in structure
These events help users understand whether the market is maintaining its direction or potentially shifting. The key idea is confirmation before action, not anticipation.
🔹 3. Use Zones as Areas of Interest, Not Certainty
After a structural event, the system highlights zones such as:
Order Blocks
Fair Value Gaps (FVGs)
These are used as reference areas, where users observe how price reacts if it returns. They are not treated as guaranteed reversal or entry points. Instead, they provide contextual locations where additional confirmation may be considered.
🔹 4. Observe Liquidity Behavior
Liquidity sweeps are used to understand how price interacts with recent highs and lows. When price briefly moves beyond these levels and then rejects, it may indicate short-term shifts in behavior. Users typically combine this observation with structure and zones to build a more complete view, rather than relying on it alone.
🔹 5. Combine Multiple Factors (Confluence Approach)
StructureX is most effective when its components are used together:
Structure direction (trend context)
Break events (confirmation)
Zones (areas of interest)
Liquidity behavior (market reaction)
This confluence-based approach helps users avoid decisions based on a single factor and encourages a more balanced evaluation of market conditions.
🔹 6. Adapt Settings to Trading Style
The system includes adjustable inputs such as swing length, detection ranges, and visibility options. Users can modify these to suit different timeframes or preferences, making the tool flexible for various styles while maintaining the same underlying logic.
🔄 Real-Time Usage Note
Because the system uses confirmation-based logic:
Some elements require candle completion to finalize
Live candles may show temporary changes
More stable interpretation is typically achieved after confirmation
This is normal behavior and reflects the system’s focus on reducing noise rather than reacting instantly.
⚠️ Important Consideration
StructureX does not provide financial advice or guaranteed outcomes. It is designed to support analysis by offering a clear structural framework, while final decisions remain dependent on the user’s own judgment and risk management.
🏁 Summary
👉
StructureX is used by first identifying market structure, waiting for confirmed break events, and then observing how price reacts around key zones and liquidity areas—allowing decisions to be made within a structured, multi-factor framework rather than relying on isolated signals.
⚙️ Settings & Customization – StructureX
StructureX provides a high level of customization so users can adapt the indicator to different trading styles, timeframes, and sensitivity preferences. The goal of these settings is not to change the core logic, but to control how strictly or loosely the market structure is interpreted and displayed.
🔹 1. Structure Sensitivity (Swing Length Settings)
The most important setting is the swing lookback length, which controls how swing highs and lows are detected.
Lower values → more sensitive structure (more swings, faster reactions)
Higher values → smoother structure (fewer swings, stronger confirmation)
This setting directly affects how often the system identifies structural points. It allows users to balance between early detection and stability depending on their strategy.
🔹 2. Internal Structure Toggle
StructureX includes an optional internal structure layer.
When enabled → shows minor intraday structure inside the main trend
When disabled → only focuses on major market structure
This is useful for users who want either:
A clean, high-level view, or
A detailed micro-structure analysis
🔹 3. BOS & CHoCH Display Controls
Users can enable or disable:
Break of Structure (BOS) labels
Change of Character (CHoCH) labels
This helps in reducing chart clutter or focusing only on specific types of structural events. It allows traders to decide whether they want a full structural map or simplified trend view.
🔹 4. Order Block Customization
Order Blocks come with multiple configurable options:
Visibility toggle: show or hide OB zones
Mitigation type (Wick / Close): defines how price invalidates or interacts with zones
Maximum active OBs: controls how many zones remain on chart
Color customization: bullish and bearish zones can be visually differentiated
These settings help users manage chart clarity and zone relevance based on their trading approach.
🔹 5. Fair Value Gap (FVG) Settings
FVG module can also be customized:
Filter options (Bullish, Bearish, or All)
Maximum number of active FVG zones
Color and transparency control
This allows users to focus only on specific imbalance types or keep full visibility depending on their analysis style.
🔹 6. Liquidity Sweep Sensitivity
Liquidity detection includes a lookback range setting, which defines how far back the system searches for key highs and lows.
Smaller range → more reactive, short-term liquidity detection
Larger range → broader, higher-timeframe liquidity focus
This helps users align liquidity analysis with their preferred trading horizon.
🔹 7. Visual Customization
StructureX provides full visual control:
Bullish and bearish structure colors
Line thickness for structure markings
Swing point visibility (HH, HL, LH, LL labels)
Trend background opacity
These settings are designed to improve readability without changing logic, allowing users to create a clean or detailed chart environment.
🔹 8. Alert Configuration
Users can enable alerts for key structural events:
BOS alerts
CHoCH alerts
Liquidity sweep alerts
This allows passive monitoring of market structure without constantly watching the chart. Alerts are based on confirmed conditions, not premature signals.
🔄 Customization Philosophy
All settings in StructureX follow a single principle:
👉 Flexibility in visualization and sensitivity, without altering the core structural logic.
This ensures that no matter how settings are adjusted, the underlying market structure interpretation remains consistent and rule-based.
🏁 Summary
👉
StructureX customization allows users to control sensitivity, structure detail level, zone visibility, and visual presentation, enabling adaptation to different trading styles while keeping the core market structure logic unchanged and consistent.
🔗 Mashup (Combined System) – StructureX
The Mashup system in StructureX refers to the way multiple independent market concepts are combined into one unified framework. Instead of treating each element separately (like structure, liquidity, order blocks, and gaps), the system merges them into a single logic flow where every component supports the other.
The main idea is not to create extra signals, but to build a multi-layer confirmation environment where market context becomes clearer and more structured.
🧠 1. Core Idea of the Mashup System
At its core, the mashup system works on this principle:
👉 “One market event = multiple confirmations across different structures.”
Instead of reacting to a single condition, StructureX combines:
Market Structure (trend direction)
Break events (BOS / CHoCH)
Liquidity behavior (sweeps)
Inefficiency zones (FVGs)
Reaction zones (Order Blocks)
Each element contributes a different perspective of the same price movement.
🔄 2. How the Combination Works
When price moves, the system does not treat it as one isolated event. Instead:
A structural break may trigger detection
That same move is checked for liquidity interaction
Then the system maps order blocks or gaps created by that move
So a single price impulse becomes a multi-layer mapped structure, where every layer explains a different part of the same movement.
This creates a more complete interpretation of market behavior.
📊 3. Layered Confirmation Logic
The mashup system follows a layered validation approach:
🔹 Layer 1 – Structure Context
Defines whether market is bullish, bearish, or transitioning.
🔹 Layer 2 – Break Confirmation
Checks if structure has been continued or shifted (BOS / CHoCH).
🔹 Layer 3 – Liquidity Interaction
Observes whether price has swept key highs/lows.
🔹 Layer 4 – Zone Formation
Identifies where imbalances or institutional interest may exist (OB / FVG).
👉 Only when multiple layers align, the market context becomes stronger and more meaningful.
⚙️ 4. Why Mashup System Is Important
Without mashup logic, analysis becomes fragmented:
Structure alone = incomplete context
Zones alone = unconfirmed areas
Liquidity alone = short-term signal
But when combined:
👉 You get context + confirmation + reaction zones in one framework
This reduces randomness in interpretation and helps create a structured decision environment.
🔄 5. Dynamic Interaction Between Components
The important part of mashup design is that all modules are interconnected but independent:
Structure influences BOS/CHoCH logic
BOS/CHoCH triggers OB and FVG detection
Liquidity sweeps provide additional context to breaks
Zones remain active until mitigated or invalidated
So the system behaves like a continuous loop, where each new candle updates multiple layers at once.
⚠️ 6. Non-Predictive Nature
Even though multiple confirmations exist, the mashup system:
Does NOT guarantee direction
Does NOT predict exact reversals
Works only on current and historical structure interpretation
All outputs are based on confirmed price action, not assumptions.
🏁 Summary
👉
The Mashup system in StructureX combines market structure, break events, liquidity behavior, and imbalance zones into a single layered framework, where each component confirms and supports the others to create a more structured and contextual market view instead of isolated signals.
⚠️ Repainting / Real-Time Behavior –
StructureX uses a pivot-based swing detection and structure logic that depends on a lookback system. This means the system does not evaluate the current candle in isolation, but instead compares it with surrounding candles within a defined range.
🔶 Pivot-Based Swing Detection & Confirmation Delay
StructureX uses a pivot-based swing detection system, which means it does not identify market swings instantly from a single candle. Instead, it compares a candle with surrounding candles within a defined lookback range. Because of this design, a swing high or swing low is only confirmed after enough candles have formed on both sides. This introduces a natural delay in confirmation, but it helps ensure that only meaningful and structurally valid swing points are used in analysis.
🔶 Structure Break Confirmation (BOS / CHoCH Logic)
In addition to swing detection, structure breaks such as Break of Structure (BOS) and Change of Character (CHoCH) are confirmed based on candle close conditions. This means the system does not rely on intrabar price movement. During an active candle, price can move up and down, temporarily crossing levels and creating changing visual signals. However, these are not final confirmations. The actual signal is only considered valid once the candle closes and the condition is fully met.
🔶 Real-Time Candle Fluctuation Behavior
Because of this behavior, the indicator may show temporary fluctuations in real time while the candle is still forming. Swing levels, structure breaks, and related markings can adjust during this phase as new price data comes in. This is a normal part of live market processing and does not represent a final or confirmed signal.
🔶 Non-Repainting Clarification
It is important to understand that this system is not repainting in the classical sense. Once a candle is closed and a signal is confirmed, it does not change retroactively. The only adjustments occur during live candle formation, where the market is still developing and incomplete data is being processed.
🔶 Design Purpose & Final Behavior
Overall, this design prioritizes accuracy and structural stability over instant signals. The slight delay and live updates are intentional features that help reduce noise and improve the reliability of the final confirmed market structure interpretation.
🏁 Final Note – StructureX
StructureX is designed as a structured market analysis framework that focuses on reading price action through clear rules rather than assumptions or predictions. Its main purpose is to convert raw and often noisy market movement into a clean structural map, where trends, breaks, and key zones can be understood in a more organized way.
The system works entirely on rule-based logic, meaning every output is generated from predefined conditions such as swing detection, structural breaks, and price interaction with key levels. Because of this, the indicator does not rely on subjective interpretation or random signals, but instead follows a consistent mathematical and structural process based on historical and real-time price data.
It is also important to understand that StructureX is confirmation-driven rather than prediction-driven. Signals like BOS, CHoCH, order blocks, and liquidity sweeps are only considered valid when price action confirms them through specific conditions, especially candle close. This ensures that the information provided reflects actual market behavior rather than temporary fluctuations during candle formation.
Due to its pivot-based and confirmation-based design, the system may show slight delays or temporary changes while candles are still forming. However, once a candle closes and conditions are confirmed, the structure becomes stable and does not change retroactively. This behavior is intentional, as it helps reduce noise and improves the reliability of the final market structure interpretation.
Overall, StructureX should be understood as a decision-support tool, not a predictive system. It helps users analyze market context in a more disciplined and structured way, combining multiple layers of price action into one framework. The effectiveness of the system depends on how well the user understands structure, context, and confirmation, rather than expecting fixed outcomes or guaranteed results.
⚠️ Disclaimer – StructureX
StructureX – Market Structure & Liquidity Engine is developed strictly for educational and informational purposes only. It is designed to help users understand and analyze market structure, price behavior, and liquidity concepts in a more organized way. The indicator does not provide financial advice, investment recommendations, or trading signals that guarantee any specific outcome.
All information displayed by this tool is based on historical and real-time market data processing, including swing detection, structural breaks, and liquidity-related zones. While these elements can assist in understanding market context, they do not predict future price movements with certainty. Markets are inherently volatile and influenced by many unpredictable factors.
Trading and investing in financial markets involve significant risk of loss. Users should not rely solely on this tool for making trading decisions. It is strongly recommended to use proper risk management, independent analysis, and, if needed, consult with a qualified financial advisor before engaging in any trading activity.
Because StructureX uses pivot-based and confirmation-based logic, some signals may appear with slight delay or may adjust during live candle formation. This is a normal characteristic of structure-based analysis tools and should not be interpreted as guaranteed accuracy or real-time certainty.
By using this indicator, you acknowledge that all trading decisions are made at your own risk, and the developer is not responsible for any financial gains or losses resulting from its use.
StructureX – Market Structure & Liquidity Engine is a comprehensive price action framework designed to interpret and visualize the natural structure of the market. Its primary objective is to transform raw price movement into a clear and organized structure, where highs, lows, and their relationships are logically defined. Instead of relying on random candle behavior, the system helps users understand how price is actually moving within a structured environment.
At its core, StructureX is built on the idea that markets are not entirely random — they move in structured phases of expansion, retracement, and transition. The system tracks these phases using rule-based calculations derived from historical price data. This ensures that the output remains consistent and systematic, rather than subjective. The focus is not on predicting the future, but on providing a clearer understanding of the current market context, allowing users to make more informed decisions within a defined framework.
StructureX integrates multiple structural elements into a single unified model, offering a layered view of market behavior. Key turning points, structural breaks, and imbalance areas are all presented together on the chart, reducing the need for multiple separate tools. This integration enhances clarity and allows users to evaluate market conditions more efficiently, with all relevant structural information available in one place.
In terms of real-time behavior, the system operates using confirmation-based logic. Certain calculations—especially those related to swing detection—require additional candles to confirm, which can introduce a slight delay. During live candle formation, some elements may temporarily update or adjust, but the structure becomes more stable once the candle closes. This is a normal and expected characteristic of structure-based analytical systems, as confirmation helps reduce noise and improve reliability.
Overall, StructureX functions as a decision-support tool that simplifies complex market behavior into a structured and readable format. It does not provide financial advice or guarantee outcomes, but instead offers a disciplined, rule-based approach to analyzing price action. By focusing on structure and context, it enables users to approach the market with greater clarity and consistency.
🧠 Core Concept – StructureX
The core concept behind StructureX is built on a simple but powerful principle: price moves in a structured way, not randomly. Instead of treating the market as unpredictable noise, the system focuses on identifying how price forms highs, lows, and transitions between them, which together define the underlying structure of the market. This structure becomes the foundation for understanding trend direction, continuation, and potential shifts.
At the heart of this approach is the idea that every market phase is a result of interaction between buying and selling pressure, which is reflected through the formation and breaking of key levels. When price creates a series of higher highs and higher lows, it reflects bullish structure; when it forms lower highs and lower lows, it reflects bearish structure. StructureX tracks these formations in a rule-based way, ensuring that structure identification is consistent and not based on subjective interpretation.
Another key part of the concept is structural validation through break events. The system does not assume a trend change or continuation until price clearly interacts with previously established levels. This is where events like Break of Structure (BOS) and Change of Character (CHoCH) come into play. These are not predictions, but confirmations that the market has either maintained its direction or transitioned into a new phase. By waiting for these confirmations, the system prioritizes clarity over speed, reducing the impact of market noise.
StructureX also incorporates the idea that price does not move efficiently at all times. There are moments where imbalances and liquidity interactions occur, leading to areas where price may react or stabilize. Instead of treating these as guaranteed reversal zones, the system presents them as contextual areas of interest, which can be used alongside structure for more informed analysis. This keeps the framework realistic and avoids over-reliance on any single factor.
Importantly, the entire concept is rule-based and data-driven, meaning all outputs are derived from historical and current price action without any forward-looking assumptions. Some components require confirmation over multiple candles, which can introduce slight delays, but this trade-off helps improve stability and reduce false signals. Real-time updates during candle formation are normal, and the structure becomes more reliable once conditions are fully confirmed.
In essence, the core concept of StructureX is to provide a structured lens through which market behavior can be interpreted, combining clarity, consistency, and multiple layers of context. It does not aim to predict exact outcomes or guarantee results, but rather to offer a disciplined framework that helps users better understand how price evolves over time and make decisions based on observable structure rather than guesswork.
⚙️ Key Features – StructureX
StructureX is designed as a multi-layered market structure framework, where each feature plays a specific role in helping users interpret price action more clearly. Instead of relying on a single signal, the system combines several rule-based components to provide a more complete view of market behavior.
🔹 1. Swing-Based Market Structure Detection
The system automatically identifies swing highs and swing lows using a defined lookback range. These points act as the foundation of the entire framework, as they represent where price has naturally turned in the past. By mapping these levels, StructureX creates a clear structural outline of the market, allowing users to visually understand how price is evolving over time.
🔹 2. Break of Structure (BOS) Identification
StructureX highlights when price breaks a previously established structural level in the direction of the current trend. This is referred to as a Break of Structure (BOS), and it indicates that the market is continuing its existing directional movement. These events are based on confirmed price interaction with key levels, helping reduce ambiguity in trend continuation analysis.
🔹 3. Change of Character (CHoCH) Detection
The system also detects potential structural transitions through Change of Character (CHoCH) events. These occur when price moves against the current structure and breaks a key level, signaling that market conditions may be shifting. Rather than predicting reversals, this feature provides early structural context that the current trend may be weakening or transitioning.
🔹 4. Order Block Visualization
StructureX marks potential order block zones, which are derived from the last opposing candles before significant structural moves. These zones are presented as areas where price has previously shown strong reaction. They are not guaranteed reaction points, but serve as contextual zones of interest where users may observe how price behaves if revisited.
🔹 5. Fair Value Gap (FVG) Detection
The system identifies price imbalances, commonly referred to as Fair Value Gaps. These occur when price moves quickly, leaving areas where trading activity was relatively low. StructureX highlights these zones to show where price may revisit or stabilize, offering additional context for understanding inefficient market movement.
🔹 6. Liquidity Sweep Identification
StructureX includes logic to detect liquidity sweeps, where price temporarily moves beyond key highs or lows and then rejects. This reflects areas where stop orders may have been triggered. The system marks these events as observational signals, helping users recognize potential shifts in short-term market behavior without making predictive claims.
🔹 7. Internal Structure (Optional Layer)
An optional internal structure feature allows users to view minor structural movements within the main trend. This adds a deeper level of analysis for those who want to study short-term fluctuations while still maintaining the broader structural context.
🔹 8. Dynamic Visualization & Trend Background
The indicator provides visual clarity through structure lines, labels, and optional background coloring based on market bias. This helps users quickly interpret whether the market is currently aligned in a bullish, bearish, or neutral state, improving readability without adding unnecessary complexity.
🔹 9. Customizable Settings
StructureX offers a range of inputs that allow users to adjust sensitivity and visual preferences, such as swing length, detection ranges, and display options. This flexibility ensures the tool can be adapted to different trading styles and timeframes without altering its core logic.
🔹 10. Alert System for Key Events
The built-in alert functionality enables users to receive notifications when important structural events occur, such as BOS, CHoCH, or liquidity sweeps. This allows for more efficient monitoring without needing to constantly watch the chart.
🏁 Summary
👉
StructureX combines multiple rule-based features—structure detection, break events, imbalance zones, and liquidity behavior—into a single framework, providing a clear and structured view of market activity without relying on predictive assumptions.
⚙️ How It Works – StructureX
StructureX operates as a rule-based analytical engine that processes price data step by step to build a structured view of the market. Instead of generating signals from a single condition, it follows a logical sequence of detection → validation → visualization, where each layer depends on the previous one.
🔹 1. Price Data Processing & Swing Identification
The system begins by scanning historical and current price data to detect swing highs and swing lows within a defined lookback range. These swings represent natural turning points in the market and form the base structure. Since this process requires surrounding candles for confirmation, there is a built-in delay that helps filter out noise and avoid premature signals.
🔹 2. Structure Formation & Bias Tracking
Once swings are identified, the system uses them to construct a market structure framework. By comparing current swings with previous ones, it determines whether the market is forming:
Higher highs / higher lows → bullish structure
Lower highs / lower lows → bearish structure
This comparison allows the system to maintain a dynamic market bias, which updates only when specific structural conditions are met. The bias is not predicted—it is derived from confirmed price behavior.
🔹 3. Break Validation (BOS & CHoCH)
After establishing structure, the system monitors how price interacts with key levels:
If price breaks a level in the direction of the current bias, it is marked as a Break of Structure (BOS), indicating continuation.
If price breaks a level against the current bias, it is marked as a Change of Character (CHoCH), suggesting a potential transition.
These events are only recognized when price clearly crosses and confirms the level, which helps reduce false interpretations and ensures consistency.
🔹 4. Contextual Zone Detection (Order Blocks & FVG)
Once a structural event (BOS/CHoCH) occurs, the system identifies contextual zones around that movement:
Order Blocks are derived from the last opposing candles before a strong move, highlighting areas where price previously showed strong reaction.
Fair Value Gaps (FVGs) are detected when price moves quickly, leaving behind areas of imbalance.
These zones are not treated as guaranteed reaction points. Instead, they are presented as areas of interest, providing additional context for how price might behave if revisited.
🔹 5. Liquidity Interaction Monitoring
The system also evaluates liquidity behavior, specifically looking for scenarios where price moves beyond recent highs or lows and then rejects. These are marked as liquidity sweeps, which can indicate short-term shifts in order flow. This feature helps users observe how price interacts with commonly targeted levels, without assuming a fixed outcome.
🔹 6. Continuous Update & Object Management
StructureX continuously updates all elements in real time:
Active zones (OBs/FVGs) are extended forward until they are invalidated
Old or mitigated zones are removed to keep the chart clean
Structure levels are maintained and updated as new data forms
This ensures the chart reflects the current state of the market, not outdated conditions.
🔹 7. Visualization & User Interaction
All detected elements are displayed using lines, labels, boxes, and optional background coloring. The goal is to provide clear visual feedback without overwhelming the user. Additionally, customizable inputs allow users to adjust sensitivity and visibility based on their preferences, while alerts notify them of key structural events.
🔄 Real-Time Behavior Note
Because the system relies on confirmation-based logic, some elements (especially swings) require multiple candles to finalize. During live candle formation, temporary changes may occur, but the structure becomes more stable once conditions are confirmed. This behavior is normal and helps improve reliability by reducing noise.
🏁 Summary
👉
StructureX works by sequentially detecting swings, validating structure through break events, mapping contextual zones, and continuously updating the chart—providing a structured, rule-based interpretation of market behavior without relying on predictive assumptions.
📊 How It Is Used – StructureX
StructureX is used as a structured analysis tool, not as a standalone signal generator. Its purpose is to help users read market conditions step by step, so decisions are based on context and confirmation, rather than isolated signals or assumptions.
🔹 1. Start with Market Structure Context
The first step is to observe the overall market structure displayed by the system. By looking at how price is forming highs and lows, users can determine whether the market is:
Moving upward (bullish structure)
Moving downward (bearish structure)
Or transitioning between phases
This step provides a directional framework, helping users avoid taking decisions against the broader structure.
🔹 2. Wait for Structural Confirmation (BOS / CHoCH)
Instead of reacting immediately to price movement, StructureX is typically used by waiting for confirmed structural events:
BOS (Break of Structure): suggests continuation within the current direction
CHoCH (Change of Character): indicates a possible transition in structure
These events help users understand whether the market is maintaining its direction or potentially shifting. The key idea is confirmation before action, not anticipation.
🔹 3. Use Zones as Areas of Interest, Not Certainty
After a structural event, the system highlights zones such as:
Order Blocks
Fair Value Gaps (FVGs)
These are used as reference areas, where users observe how price reacts if it returns. They are not treated as guaranteed reversal or entry points. Instead, they provide contextual locations where additional confirmation may be considered.
🔹 4. Observe Liquidity Behavior
Liquidity sweeps are used to understand how price interacts with recent highs and lows. When price briefly moves beyond these levels and then rejects, it may indicate short-term shifts in behavior. Users typically combine this observation with structure and zones to build a more complete view, rather than relying on it alone.
🔹 5. Combine Multiple Factors (Confluence Approach)
StructureX is most effective when its components are used together:
Structure direction (trend context)
Break events (confirmation)
Zones (areas of interest)
Liquidity behavior (market reaction)
This confluence-based approach helps users avoid decisions based on a single factor and encourages a more balanced evaluation of market conditions.
🔹 6. Adapt Settings to Trading Style
The system includes adjustable inputs such as swing length, detection ranges, and visibility options. Users can modify these to suit different timeframes or preferences, making the tool flexible for various styles while maintaining the same underlying logic.
🔄 Real-Time Usage Note
Because the system uses confirmation-based logic:
Some elements require candle completion to finalize
Live candles may show temporary changes
More stable interpretation is typically achieved after confirmation
This is normal behavior and reflects the system’s focus on reducing noise rather than reacting instantly.
⚠️ Important Consideration
StructureX does not provide financial advice or guaranteed outcomes. It is designed to support analysis by offering a clear structural framework, while final decisions remain dependent on the user’s own judgment and risk management.
🏁 Summary
👉
StructureX is used by first identifying market structure, waiting for confirmed break events, and then observing how price reacts around key zones and liquidity areas—allowing decisions to be made within a structured, multi-factor framework rather than relying on isolated signals.
⚙️ Settings & Customization – StructureX
StructureX provides a high level of customization so users can adapt the indicator to different trading styles, timeframes, and sensitivity preferences. The goal of these settings is not to change the core logic, but to control how strictly or loosely the market structure is interpreted and displayed.
🔹 1. Structure Sensitivity (Swing Length Settings)
The most important setting is the swing lookback length, which controls how swing highs and lows are detected.
Lower values → more sensitive structure (more swings, faster reactions)
Higher values → smoother structure (fewer swings, stronger confirmation)
This setting directly affects how often the system identifies structural points. It allows users to balance between early detection and stability depending on their strategy.
🔹 2. Internal Structure Toggle
StructureX includes an optional internal structure layer.
When enabled → shows minor intraday structure inside the main trend
When disabled → only focuses on major market structure
This is useful for users who want either:
A clean, high-level view, or
A detailed micro-structure analysis
🔹 3. BOS & CHoCH Display Controls
Users can enable or disable:
Break of Structure (BOS) labels
Change of Character (CHoCH) labels
This helps in reducing chart clutter or focusing only on specific types of structural events. It allows traders to decide whether they want a full structural map or simplified trend view.
🔹 4. Order Block Customization
Order Blocks come with multiple configurable options:
Visibility toggle: show or hide OB zones
Mitigation type (Wick / Close): defines how price invalidates or interacts with zones
Maximum active OBs: controls how many zones remain on chart
Color customization: bullish and bearish zones can be visually differentiated
These settings help users manage chart clarity and zone relevance based on their trading approach.
🔹 5. Fair Value Gap (FVG) Settings
FVG module can also be customized:
Filter options (Bullish, Bearish, or All)
Maximum number of active FVG zones
Color and transparency control
This allows users to focus only on specific imbalance types or keep full visibility depending on their analysis style.
🔹 6. Liquidity Sweep Sensitivity
Liquidity detection includes a lookback range setting, which defines how far back the system searches for key highs and lows.
Smaller range → more reactive, short-term liquidity detection
Larger range → broader, higher-timeframe liquidity focus
This helps users align liquidity analysis with their preferred trading horizon.
🔹 7. Visual Customization
StructureX provides full visual control:
Bullish and bearish structure colors
Line thickness for structure markings
Swing point visibility (HH, HL, LH, LL labels)
Trend background opacity
These settings are designed to improve readability without changing logic, allowing users to create a clean or detailed chart environment.
🔹 8. Alert Configuration
Users can enable alerts for key structural events:
BOS alerts
CHoCH alerts
Liquidity sweep alerts
This allows passive monitoring of market structure without constantly watching the chart. Alerts are based on confirmed conditions, not premature signals.
🔄 Customization Philosophy
All settings in StructureX follow a single principle:
👉 Flexibility in visualization and sensitivity, without altering the core structural logic.
This ensures that no matter how settings are adjusted, the underlying market structure interpretation remains consistent and rule-based.
🏁 Summary
👉
StructureX customization allows users to control sensitivity, structure detail level, zone visibility, and visual presentation, enabling adaptation to different trading styles while keeping the core market structure logic unchanged and consistent.
🔗 Mashup (Combined System) – StructureX
The Mashup system in StructureX refers to the way multiple independent market concepts are combined into one unified framework. Instead of treating each element separately (like structure, liquidity, order blocks, and gaps), the system merges them into a single logic flow where every component supports the other.
The main idea is not to create extra signals, but to build a multi-layer confirmation environment where market context becomes clearer and more structured.
🧠 1. Core Idea of the Mashup System
At its core, the mashup system works on this principle:
👉 “One market event = multiple confirmations across different structures.”
Instead of reacting to a single condition, StructureX combines:
Market Structure (trend direction)
Break events (BOS / CHoCH)
Liquidity behavior (sweeps)
Inefficiency zones (FVGs)
Reaction zones (Order Blocks)
Each element contributes a different perspective of the same price movement.
🔄 2. How the Combination Works
When price moves, the system does not treat it as one isolated event. Instead:
A structural break may trigger detection
That same move is checked for liquidity interaction
Then the system maps order blocks or gaps created by that move
So a single price impulse becomes a multi-layer mapped structure, where every layer explains a different part of the same movement.
This creates a more complete interpretation of market behavior.
📊 3. Layered Confirmation Logic
The mashup system follows a layered validation approach:
🔹 Layer 1 – Structure Context
Defines whether market is bullish, bearish, or transitioning.
🔹 Layer 2 – Break Confirmation
Checks if structure has been continued or shifted (BOS / CHoCH).
🔹 Layer 3 – Liquidity Interaction
Observes whether price has swept key highs/lows.
🔹 Layer 4 – Zone Formation
Identifies where imbalances or institutional interest may exist (OB / FVG).
👉 Only when multiple layers align, the market context becomes stronger and more meaningful.
⚙️ 4. Why Mashup System Is Important
Without mashup logic, analysis becomes fragmented:
Structure alone = incomplete context
Zones alone = unconfirmed areas
Liquidity alone = short-term signal
But when combined:
👉 You get context + confirmation + reaction zones in one framework
This reduces randomness in interpretation and helps create a structured decision environment.
🔄 5. Dynamic Interaction Between Components
The important part of mashup design is that all modules are interconnected but independent:
Structure influences BOS/CHoCH logic
BOS/CHoCH triggers OB and FVG detection
Liquidity sweeps provide additional context to breaks
Zones remain active until mitigated or invalidated
So the system behaves like a continuous loop, where each new candle updates multiple layers at once.
⚠️ 6. Non-Predictive Nature
Even though multiple confirmations exist, the mashup system:
Does NOT guarantee direction
Does NOT predict exact reversals
Works only on current and historical structure interpretation
All outputs are based on confirmed price action, not assumptions.
🏁 Summary
👉
The Mashup system in StructureX combines market structure, break events, liquidity behavior, and imbalance zones into a single layered framework, where each component confirms and supports the others to create a more structured and contextual market view instead of isolated signals.
⚠️ Repainting / Real-Time Behavior –
StructureX uses a pivot-based swing detection and structure logic that depends on a lookback system. This means the system does not evaluate the current candle in isolation, but instead compares it with surrounding candles within a defined range.
🔶 Pivot-Based Swing Detection & Confirmation Delay
StructureX uses a pivot-based swing detection system, which means it does not identify market swings instantly from a single candle. Instead, it compares a candle with surrounding candles within a defined lookback range. Because of this design, a swing high or swing low is only confirmed after enough candles have formed on both sides. This introduces a natural delay in confirmation, but it helps ensure that only meaningful and structurally valid swing points are used in analysis.
🔶 Structure Break Confirmation (BOS / CHoCH Logic)
In addition to swing detection, structure breaks such as Break of Structure (BOS) and Change of Character (CHoCH) are confirmed based on candle close conditions. This means the system does not rely on intrabar price movement. During an active candle, price can move up and down, temporarily crossing levels and creating changing visual signals. However, these are not final confirmations. The actual signal is only considered valid once the candle closes and the condition is fully met.
🔶 Real-Time Candle Fluctuation Behavior
Because of this behavior, the indicator may show temporary fluctuations in real time while the candle is still forming. Swing levels, structure breaks, and related markings can adjust during this phase as new price data comes in. This is a normal part of live market processing and does not represent a final or confirmed signal.
🔶 Non-Repainting Clarification
It is important to understand that this system is not repainting in the classical sense. Once a candle is closed and a signal is confirmed, it does not change retroactively. The only adjustments occur during live candle formation, where the market is still developing and incomplete data is being processed.
🔶 Design Purpose & Final Behavior
Overall, this design prioritizes accuracy and structural stability over instant signals. The slight delay and live updates are intentional features that help reduce noise and improve the reliability of the final confirmed market structure interpretation.
🏁 Final Note – StructureX
StructureX is designed as a structured market analysis framework that focuses on reading price action through clear rules rather than assumptions or predictions. Its main purpose is to convert raw and often noisy market movement into a clean structural map, where trends, breaks, and key zones can be understood in a more organized way.
The system works entirely on rule-based logic, meaning every output is generated from predefined conditions such as swing detection, structural breaks, and price interaction with key levels. Because of this, the indicator does not rely on subjective interpretation or random signals, but instead follows a consistent mathematical and structural process based on historical and real-time price data.
It is also important to understand that StructureX is confirmation-driven rather than prediction-driven. Signals like BOS, CHoCH, order blocks, and liquidity sweeps are only considered valid when price action confirms them through specific conditions, especially candle close. This ensures that the information provided reflects actual market behavior rather than temporary fluctuations during candle formation.
Due to its pivot-based and confirmation-based design, the system may show slight delays or temporary changes while candles are still forming. However, once a candle closes and conditions are confirmed, the structure becomes stable and does not change retroactively. This behavior is intentional, as it helps reduce noise and improves the reliability of the final market structure interpretation.
Overall, StructureX should be understood as a decision-support tool, not a predictive system. It helps users analyze market context in a more disciplined and structured way, combining multiple layers of price action into one framework. The effectiveness of the system depends on how well the user understands structure, context, and confirmation, rather than expecting fixed outcomes or guaranteed results.
⚠️ Disclaimer – StructureX
StructureX – Market Structure & Liquidity Engine is developed strictly for educational and informational purposes only. It is designed to help users understand and analyze market structure, price behavior, and liquidity concepts in a more organized way. The indicator does not provide financial advice, investment recommendations, or trading signals that guarantee any specific outcome.
All information displayed by this tool is based on historical and real-time market data processing, including swing detection, structural breaks, and liquidity-related zones. While these elements can assist in understanding market context, they do not predict future price movements with certainty. Markets are inherently volatile and influenced by many unpredictable factors.
Trading and investing in financial markets involve significant risk of loss. Users should not rely solely on this tool for making trading decisions. It is strongly recommended to use proper risk management, independent analysis, and, if needed, consult with a qualified financial advisor before engaging in any trading activity.
Because StructureX uses pivot-based and confirmation-based logic, some signals may appear with slight delay or may adjust during live candle formation. This is a normal characteristic of structure-based analysis tools and should not be interpreted as guaranteed accuracy or real-time certainty.
By using this indicator, you acknowledge that all trading decisions are made at your own risk, and the developer is not responsible for any financial gains or losses resulting from its use.
Skrip open-source
Dengan semangat TradingView yang sesungguhnya, pembuat skrip ini telah menjadikannya sebagai sumber terbuka, sehingga para trader dapat meninjau dan memverifikasi fungsinya. Salut untuk penulisnya! Meskipun Anda dapat menggunakannya secara gratis, perlu diingat bahwa penerbitan ulang kode ini tunduk pada Tata Tertib kami.

Pernyataan Penyangkalan
Informasi dan publikasi ini tidak dimaksudkan, dan bukan merupakan, saran atau rekomendasi keuangan, investasi, trading, atau jenis lainnya yang diberikan atau didukung oleh TradingView. Baca selengkapnya di Ketentuan Penggunaan.
Skrip open-source
Dengan semangat TradingView yang sesungguhnya, pembuat skrip ini telah menjadikannya sebagai sumber terbuka, sehingga para trader dapat meninjau dan memverifikasi fungsinya. Salut untuk penulisnya! Meskipun Anda dapat menggunakannya secara gratis, perlu diingat bahwa penerbitan ulang kode ini tunduk pada Tata Tertib kami.
Pernyataan Penyangkalan
Informasi dan publikasi ini tidak dimaksudkan, dan bukan merupakan, saran atau rekomendasi keuangan, investasi, trading, atau jenis lainnya yang diberikan atau didukung oleh TradingView. Baca selengkapnya di Ketentuan Penggunaan.