MES 1-Day and 3-Day Equilibrium
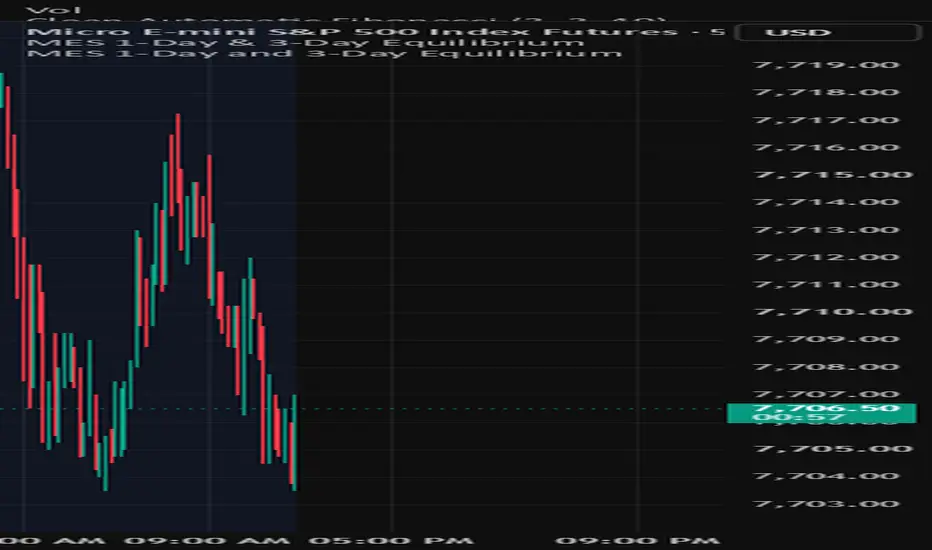
The MES 1-Day and 3-Day Equilibrium indicator helps traders identify where price is balanced over two short-term periods.
The yellow line shows the previous trading day’s equilibrium,calculated as the midpoint between the previous day’s high and low.
The blue line shows the 3-day equilibrium—calculated as the midpoint between the highest high and lowest low from the previous three completed trading days.
How I use it:
• Price above both lines suggests a bullish bias.
• Price below both lines suggests a bearish bias.
• Price between the two lines suggests mixed or balanced conditions.
The background turns light green when price is above both equilibrium levels and light red when price is below both. Each current level is identified with a label on the right side of the chart.
The indicator automatically adjusts to the symbol being viewed and can be used with futures, stocks, ETFs and indexes. It is designed primarily for intraday charts.
This indicator does not provide automatic buy or sell signals. I use it as a reference for market direction, possible support and resistance, and confirmation alongside price action, volume and risk management.
The yellow line shows the previous trading day’s equilibrium,calculated as the midpoint between the previous day’s high and low.
The blue line shows the 3-day equilibrium—calculated as the midpoint between the highest high and lowest low from the previous three completed trading days.
How I use it:
• Price above both lines suggests a bullish bias.
• Price below both lines suggests a bearish bias.
• Price between the two lines suggests mixed or balanced conditions.
The background turns light green when price is above both equilibrium levels and light red when price is below both. Each current level is identified with a label on the right side of the chart.
The indicator automatically adjusts to the symbol being viewed and can be used with futures, stocks, ETFs and indexes. It is designed primarily for intraday charts.
This indicator does not provide automatic buy or sell signals. I use it as a reference for market direction, possible support and resistance, and confirmation alongside price action, volume and risk management.

Pernyataan Penyangkalan
Informasi dan publikasi ini tidak dimaksudkan, dan bukan merupakan, saran atau rekomendasi keuangan, investasi, trading, atau jenis lainnya yang diberikan atau didukung oleh TradingView. Baca selengkapnya di Ketentuan Penggunaan.
Pernyataan Penyangkalan
Informasi dan publikasi ini tidak dimaksudkan, dan bukan merupakan, saran atau rekomendasi keuangan, investasi, trading, atau jenis lainnya yang diberikan atau didukung oleh TradingView. Baca selengkapnya di Ketentuan Penggunaan.